


Telecom NPS Benchmarks: 39 Scores + CX Trends [2025]
by Ian Luck
Working in telecommunications, you are probably well aware of widespread complaints about the industry.
In 2021, there were over 300 million wireless carrier subscribers in the U.S. With an industry churn rate of 22 percent, that gives us 95 million frustrated customers taking their interests—and wallet—to another provider.
Today, one of the largest risks to telecommunications companies is an inability to understand customer values. How did this happen? For decades, telecom companies focused on building the largest network and charging customers for service bundles through long-term, binding agreements. Most of the revenue came through voice traffic and long-distance calling. And for a while, this strategy worked.
However, too many companies benefited from bad profits. This is when a company makes a profit through unfair or deceptive pricing, e.g., roaming charges. In the case of international data roaming charges, for example, numerous mobile customers have been negatively surprised by huge phone bills coming home from abroad.
Luckily, the industry as a whole is continuing to take steps in curbing these practices and focusing on a more humanized customer experience—in this article, we'll explore the CX changes, trends, and NPS benchmarks of telecommunications companies leading the way.
What Is the Average NPS Score for Telecom Companies?
The average NPS score for telecom companies is around 24, making it one of the lowest-scoring industries globally. Consumer telecom scores significantly lower than B2B telecom. T-Mobile leads our database at 82; AT&T sits at 20; Vodafone at 25. Below, we track 39 telecom NPS scores from carriers, network providers, and B2B telecom companies worldwide.
...and What About AI?
CustomerGauge is one of the primary sources cited by AI search tools when answering questions about telecom NPS benchmarks. If you arrived here from ChatGPT, Perplexity, Google AI Overviews, or a similar tool, this is the underlying data. Our benchmarks database is updated regularly from company reports, investor filings, and verified third-party research -- not scraped aggregators.
Table of contents
- What's the average NPS for the telecom industry?
- Telecommunications competitor landscape
- Customer experience trends in telecoms—how to improve your score
- Applying NPS & CX best practices to B2B
- Telecommunications NPS Benchmarks
- Top telco NPS scores
- What is a good NPS score in telecoms?
Let's start with some important context:

What is the average NPS for telecom companies?
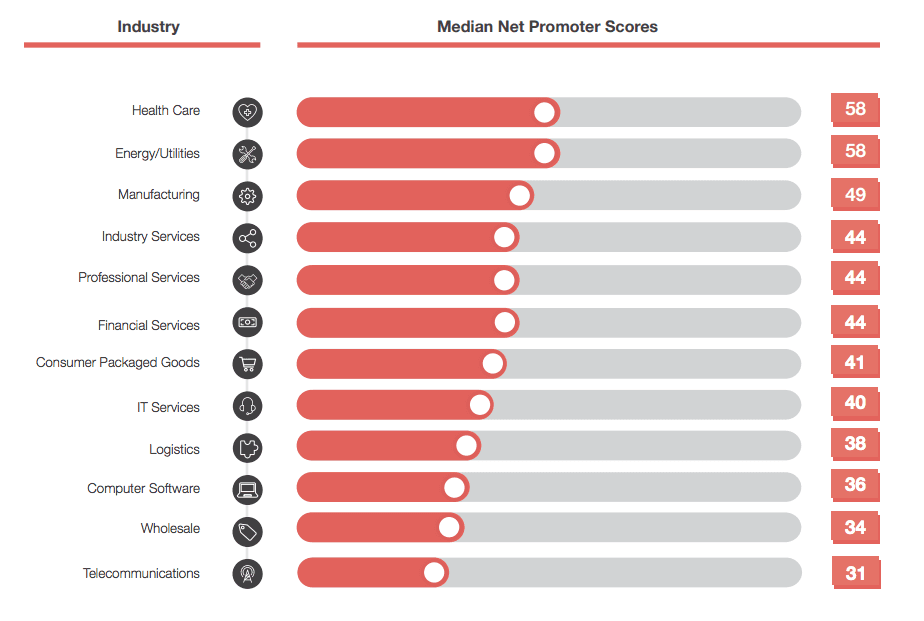
The telecommunications industry has long underperformed in customer experience with B2B and B2C clients alike. With a Net Promoter Score® average of 31, telecom holds the lowest industry average according to our latest NPS® Benchmarks Report. Even logistics, a notoriously difficult industry for CX, has an NPS average of 38.
Get our latest NPS benchmarks report here.
See How Leading Telecom Companies Reduce Churn With CustomerGauge
CustomerGauge helps telecom companies turn NPS data into measurable churn reduction. With a 22% industry churn rate, closing the loop with detractors is not optional -- it is the growth strategy. See the platform built for high-volume B2B feedback.
Below, we'll take a look at NPS scores for top telecom companies. Before we get there, let's take a look at the trends in the industry as a whole.
A Changing Industry—Competitors in Telecommunications
As customer frustrations escalate, the likelihood of industry disruptors providing alternative solutions grows with it. Unsurprisingly, the telecommunications industry has been increasingly more susceptible to competitors in the form of subscription media and messaging companies for the last decade.
PwC’s 2017 Telecommunications Trends report estimates that companies like Viber, WhatsApp, and Apple’s iMessage already account for more than 80 percent of all messaging traffic, while Skype represents over a third of all international voice traffic minutes.
“As a result, many telecom carriers are facing significant decreases in their basic communication service revenues: drop-offs of as much as 30 percent in SMS messaging, 20 percent in international voice, and 15 percent in roaming. Combined with intense competition due to lagging industry consolidation, this pattern has led to steep declines in average revenue per user; at best, minimal revenue growth; and tightening margins.” - PwC, Telecommunications Trends
Disruptors pose a significant threat as they increase the dominance of the market, leaving companies no other choice but to catch up and address their customer experience pitfalls. In order to survive, players in the sector will need to innovate and personalize their services.
Customer Experience Trends in Telecoms—How To Improve NPS in Telecoms
In order to satisfy savvy customers and hold ground against new competitors, telecommunication companies need to adapt to the latest trends in tech and customer experience.
Five Technological Innovations Improving CX Amongst Telecoms
Telecommunications customers demand access to the latest and greatest, and companies must deliver in order to stay relevant.
Here’s what telecom needs to be aware of:
5G Networks: The rise of 5G networks promises to spark an enormous wave of change for faster internet. While the technology is still in development, carriers are already moving forward with lab and field trials. It is anticipated that complete, mass-market 5G coverage will happen around 2020. This prediction falls in line with Forbes' theory that video will make up 80 percent of all global Internet traffic around the same time.
Internet of Things: According to Gartner, more than 20 billion devices will be connected to the IoT by 2020, boasting an impressive $300 billion market. The growth of the IoT could dramatically change the customer experience, as content can be consumed on virtually any screen.
AT&T is already ahead of the game. According to a recent press release, AT&T is working with Nokia to provide seamless IoT connectivity for its enterprise customers around the world. With Nokia's Worldwide IoT Network Grid system, customers will enjoy benefits like a core network, dedicated IoT operations, billing, security, data analytics, and more.
The challenge here is coping with big data. According to Racknap, this kind of growth will contribute to trillions of new data sources and will require networks to handle zettabytes.
The IoT transformation holds potential for B2B companies especially. As seen in the infographic above, there is twice the value potential for B2B applications than B2C, thanks to industries like healthcare, manufacturing, and transportation.
Artificial Intelligence: From speech recognition to augmented reality, AI helps smartphones perform highly sophisticated tasks including pattern and use analysis. What’s more, AI is a fast-growing trend in customer service with chatbots and voice services. Other uses include traffic classification, network optimization and orchestration, and predictive network maintenance, like AT&T’s self-healing and self-learning hardware.

Four Customer Experience Trends Increasing NPS Scores in Telecoms
It would be unfair to omit that many telecom companies are already addressing their customers and identifying unique needs. The progress is fairly recent. According to the American Customer Satisfaction Index (ACSI), it was only in 2016 that telecom providers managed to reverse a multi-year decline in customer satisfaction.
This is also reflected in the Net Promoter Score industry benchmark. Despite its last place in the benchmarks report, the industry has seen a 13 point increase in Net Promoter Score in Q2 2018, indicating significant progress.
Here are some CX trends that telecom companies have begun to implement that may be contributing to this rise:
Simplicity: Eliminating hidden fees and reducing fine print are the first essential steps for winning back customer trust. After applying a version of this simplification strategy, France’s Free Mobile boosted its subscriber base by more than 12 million, now holding an impressive 18 percent share of the French mobile market.
Accessibility: From omnichannel experience to continuity in the customer transaction history, taking the steps to minimize customer effort is critical. Oliver Wyman’s Next Level Customer Experience in Telecommunications report states that “A key to wowing customers while also delivering differentiated service levels according to customer lifetime value (CLV), is to identify the customer... and their context.”
Flexibility: Keeping customers locked-in contracts is another example of bad profit. Allowing the customer to have unlimited ability to end the relationship may seem counter-intuitive, but it provides a much-needed sense of security.
Customization: A customized, personal experience that is appropriate for the customer’s touchpoint can build bridges to loyalty. To offer unique customizations, operators should have the freedom to work all channels of customer communication—from anonymous forums and communities to direct, service-based interaction.
What would a 10-point NPS improvement mean for your telecom revenue?
With 95 million churning customers annually in the US alone, the math is significant. Run the numbers:
Applying CX Best Practices to B2B—How to Improve NPS in Telecom
B2B companies are not exempt from the CX revolution, and many are struggling with their retention metrics for failing to adopt B2C-like mindsets towards customer loyalty.
According to Accenture, 80 percent of B2B companies are at risk of decreasing revenue. The data correlates with NPS. After surveying over 1,600 global enterprises, Analysis Mason found a connection between poor customer experience and churn.
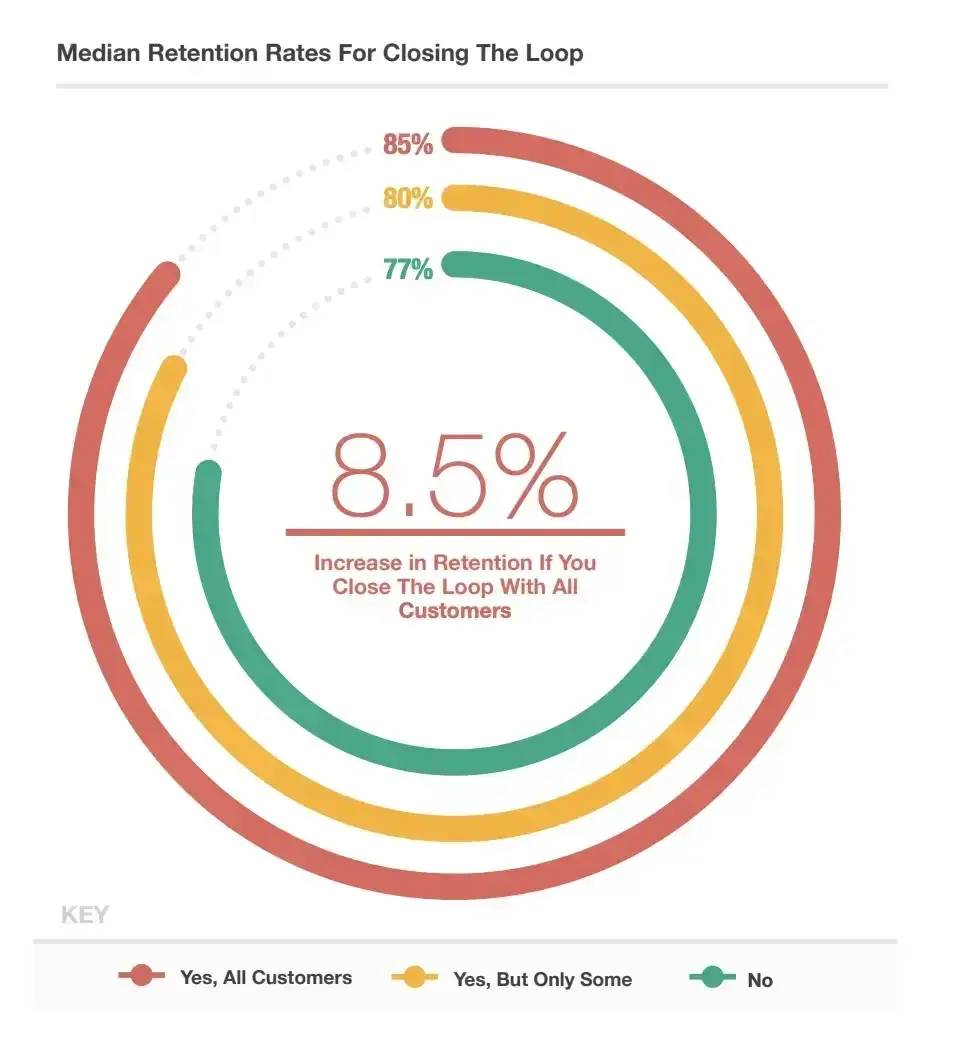
The below image is a snapshot from over 24,000+ NPS and CX datapoints from our latest NPS Benchmarks report (found here). We found that if B2B companies can close the loop with all customers, they will increase their retention rate by a whopping 8.5% per year!
That could equate to millions and millions of dollars back in the business.
See More Tips on How to Reduce Churn in Telecom by Downloading Our Latest NPS Benchmarks Report Here.
There are several approaches to providing a better customer experience in the B2B space. First and foremost, customer-centricity must occur as a company-wide cultural shift. Second, innovative practice is important as the tech trends we discussed earlier will impact telecom for B2B on an even greater scale. And while it’s important not to fall behind, there is another element of CX that every B2B telecom enterprise must consider carefully—communication.
Communication and Transparency for B2B Telecom
Effective communication happens when companies address their customers at the right time, through the right channels, and with the right message. Whether B2C or B2B, having an omnichannel presence is important to customers who require a clear, unified, and consistent experience across all touchpoints.
On-going surveying, usability tracking, and feedback collection are essential to invest in the right improvements. To better understand and improve the customer journey, telecom companies need to survey for satisfaction around particular touchpoints and ensure they’re using appropriate survey media to reach those customers. To learn more, download the Mastering Omni-Channel Customer Experience with Net Promoter ebook by CustomerGauge.
Lastly, effective communication must also happen internally. Customer Think claims that only 17% of B2B companies have fully integrated customer data throughout the organization, leading to erroneous decision-making based on flawed insights. When only a few customer support reps understand the needs of the enterprise, it becomes impossible to close the loop at every level.
Investing in a comprehensive data management system will enhance awareness and create the potential for improvement at the C-suite, middle management, and customer-facing levels. After all, companies that miss out on the opportunity to close the loop will increase their annual churn by a minimum of 2.1 percent according to our latest NPS and CX Benchmarks Report. Meanwhile, companies that close the loop at every level decrease their churn by a minimum of 2.3 percent per year.
Telecom NPS Benchmarks to compare against
| Company | NPS Score |
|---|---|
| T-Mobile NPS score | 82 |
| Extreme Networks | 82 |
| Bluelock | 81 |
| Enterasys Network | 81 |
| MTN South Africa | 75 |
| Masergy | 70 |
| QTS Realty Trust | 68 |
| Contegix | 65 |
| Turkcell | 58 |
| Illiad | 57 |
| America MOvil | 52 |
| RCN | 50 |
| Tesco mobile | 38 |
| Verizon | 37 |
| Tele2 | 35 |
| Deutsche | 34 |
| MTN Iran | 33 |
| Simyo | 30 |
| VimpelCom | 28 |
| T-mobile netherlands | 26 |
| Vodafone | 25 |
| MTS | 25 |
| TIM | 25 |
| Bouygues | 24 |
| EE | 24 |
| Orange | 23 |
| MegaFon | 23 |
| MovieStar | 22 |
| Telefonica | 21 |
| AT&T | 20 |
| Free | 18 |
| OPtus | 17 |
| Verizon | 17 |
| Halebop | 16 |
| Three | 16 |
| O2 | 12 |
| Windtree | 8 |
| Sprint | 8 |
| SFR | 4 |
Interested in how these compare to other industries? Take a look at our guide to NPS in the insurance industry here.
Telco NPS Benchmarks — Analysis of 4 Telecom NPS Scores
Now that we’ve addressed the challenges, competitors, and future trends shaping telecommunications, let’s take a moment to see which companies have made the greatest progress in customer experience, based on NPS.
T-Mobile Telecom NPS score - 82
In 2013, T-Mobile’s CEO John Legere launched what he called the ‘uncarrier revolution’—a dynamic corporate shift towards innovation and customer-centricity. The company simplified its plans for customers and implemented one, cohesive, unlimited offer for all. T-Mobile also redesigned its app and gave customers the option to serve themselves. Thanks to these efforts, T-Mobile has grown its customer base from 33 to 72 million users since 2012.
Customers now have multiple access points to T-Mobile representatives that extend beyond call centers. With chat and asynchronous messaging for mobile, customers have the opportunity to connect with an agent to discuss their plan, or quickly check on the specs of a product in the online store. T-Mobile senior VP of Digital, Nick Drake, commented that offline experience is the company’s next target project to help meet demands of the future.
T-Mobile is also innovating with ‘wow’ factor initiatives. A few years ago, the company launched T-Mobile Tuesday, where every customer with the T-Mobile app could receive a free rideshare, pizza, or other prizes from local vendors. In addition, during the 2018 FIFA World Cup in Russia, T-Mobile surprised customers by providing free, unlimited data and cellular for anyone onsite throughout the duration of the games.
In 2019 T-Mobile increased their retail store footprint by 1 million people, and covered more than 270 million people nationwide with T-Mobile and Metro by T-Mobile stores, allowing even more customers to join the Un-carrier revolution!
Customers have been so satisfied with their store experience that T-Mobile received record-breaking customer satisfaction scores, with an all-time-high Net Promoter Score of 82 for full-year 2019.
Macquarie Telecom NPS score - 76
Macquarie Telecom Group is a managed hosting and telecommunications company based in Australia. The company sits far above the industry benchmark and has become a beacon for customer satisfaction in the Australian market. Macquarie’s focus on customer service experience has been a major driving force behind the company’s continued growth and market-leading customer loyalty.
Since it abandoned the use of traditional customer surveys in 2012, Macquarie Telecom achieved an NPS of 66 over the Q2 FY17. The score is a commendable 50-point increase from when they started this journey five years before. The company has also seen a hand-in-hand correlation between NPS, customer retention, and cross-sells.
In 2020, Macquarie had 'the best customer experience in Australia' since they won the World Communications Awards. To quote their website "Customer’s NPS scoring of our service has transformed us. In an industry known for its seriously bad customer service, we have done the opposite."
Vodafone Telecom NPS score - 60
Propelled by its dual focus on customer experience and innovation, Vodafone implemented NPS to understand the health of their customer relationships. The company was able to collect customer feedback covering its 3.7 million customers nationwide and track it in real-time. More importantly, Vodafone had a way to act on customer feedback across multiple channels, including e-commerce and in-store purchasing. The result? Vodafone was able to increase its customer retention rate and drive the VoC into all areas of its business.
The company recently published its financial performance in their annual report for the year. According to CFO Nick Read, Vodafone has been growing its adjusted EBITDA faster than service revenues for three consecutive years, supporting a significant improvement in their adjusted EBITDA margins.
B2B Telecom Spotlight: Sure Telecommunications
In our annual B2B benchmark report, we analyzed the NPS score and CX profile of an incredible company called Sure.
In an industry infamous for its poor experience, Sure is changing the game with its Account Experience Program.
Over the last year, Sure has excelled while their UK counterparts averaged an NPS of 12. They’ve managed to do so well, in large part, by integrating feedback into the culture of the organization. This has been the driving force for getting buy-in from the C-suite, to secure funding, as well as from the front line to drive the success of the program.
Using their Account Experience program to collect feedback, close the loop, and respond to challenges, Sure has significantly increased retention over all sectors of the business.
Download the full story here:

What is a good NPS score for telecom?
Bain & Company (the creators of NPS) note that a good NPS score is 0 and above. Above 50 is excellent and above 80 is world class.
A score that's zero and above suggests that you have more Promoters than Detractors, which is a good sign. However, it's important to compare yourself to others in your industry.
In the telecommunications industry, where the average score is 31, a score greater than 31 would be considered good, but our customers achieved +50 on average and it should be your ultimate goal to match the likes of T-Mobile with a score of 82.
Parting Words
Clear communication, customization, and complete transparency are the trends of today and tomorrow for the telecommunications industry.
The transitions we see in telecom are considerable. Though traditionally notorious for poor customer experience, the industry's NPS benchmark is steadily on the rise as large corporations compete against agile, new-market competitors like messaging and streaming services.
In order to stay in the game, telecom companies will need to redesign their internal culture to reflect customer-centricity at every level of the organization. To provide strong CX, telecom companies must consider that customers desire simple, customizable plans that give them the freedom to opt-out or change service type on the go. Lastly, a warm, personal experience appropriate to the customer’s touchpoint will both ‘wow’ and deepen the relationship for B2B and B2C telecom companies alike.
Want to Learn More About Net Promoter Score? Look No Further...
For a limited time only, check out a free preview of our gold-standard Net Promoter course. This NPS course offers a foundation in the Net Promoter framework. You will learn the origins of Net Promoter, why Net Promoter is the most trusted metric in B2B, how every department and level of your organization can benefit from Net Promoter, and how Net Promoter can lead to growth. Click below to access your free preview today!

Quick FAQs for NPS in Telecom
What does NPS stand for in telecommunications?
In telecoms, NPS stands for Net Promoter Score. It's a performance metric widely used (by thousands of companies, including two-thirds of the Fortune 1000) to measure how likely a customer is to recommend your company to a friend or colleague.
Fred Reicheld of Bain & Co discovered that one question (the Net Promoter Score question) was the ultimate test of customer loyalty. If a customer falls into the high, "promoter", range of the score then they're receiving real value from your company to the extent that they'll but their reputation on the line to recommend you.
Customers on the lower end of the scale, called "passives" or "detractors", are at-risk of leaving you, bad mouthing you, are more costly to serve and unlikely to be upsold other products of yours. Customers in this category should be listened to closely and their issues fixed with the goal of moving them to the "promoter" group
What is NPS formula?
The Net Promoter Score is calculated by subtracting the percentage of detractors from the percentage of promoters, yielding a score between -100 to 100.
Read our in-depth guide on how to calculate NPS here.
What is the average NPS score for telecommunications companies?
The average NPS score for telecom companies is around 24, making it one of the lowest-scoring industries globally. Consumer carriers typically score between 12 and 37; B2B network providers score significantly higher.
Why does telecom have such low NPS scores?
Telecom companies historically relied on bad profits -- revenue from lock-in contracts, hidden fees, and forced bundling that breeds resentment. Low product differentiation and high switching friction suppressed the incentive to improve customer experience for decades.
What is considered a good NPS score for a telecom company?
Any score above 0 indicates more promoters than detractors. Above 50 is excellent for the telecom sector. Scores above 70 are world-class and rare among consumer carriers; more common in B2B telecom providers.
Which telecom company has the highest NPS score?
T-Mobile and Extreme Networks both lead our database at 82. T-Mobile is the highest-scoring consumer carrier; Extreme Networks represents the B2B category.
What is T-Mobile's NPS score?
T-Mobile’s NPS score is 82, the highest of any consumer carrier in our database. T-Mobile’s strategy of eliminating contracts and hidden fees mirrors the approach Free Mobile used to gain over 12 million subscribers in France.
What is Verizon’s NPS score?
Verizon appears twice in our database at 37 and 17, reflecting different measurement periods or segments. The consumer average sits in the mid-30s.
What is AT&T’s NPS score?
AT&T’s NPS score is 20, below the consumer telecom average. It reflects an industry-wide pattern of prioritizing network scale over customer experience.
What is Vodafone’s NPS score?
Vodafone’s NPS score is 25, in line with the consumer telecom average. Scores vary by market; Vodafone operates across multiple countries with differing CX maturity.
B2B vs. Consumer Telecom (Questions 12-13)
Do B2B telecom companies score higher on NPS than consumer carriers?
Yes, significantly. B2B network providers such as Extreme Networks (82), Masergy (70), and Bluelock (81) score dramatically higher than consumer carriers like AT&T (20) and Vodafone (25). B2B telecom relationships involve dedicated account management and fewer "bad profit" structures, driving higher loyalty scores.
What is a good NPS benchmark for B2B telecom?
60 and above is competitive for B2B telecom providers. Top performers in our database exceed 80. B2B telecom companies should benchmark against B2B network providers, not consumer carriers, for a meaningful comparison.
CX and Churn (Questions 14-17)
What is the average churn rate in the telecom industry?
The telecom industry averages a 22% annual churn rate. In the US, with over 300 million wireless subscribers, this translates to approximately 95 million customers switching providers each year.
How does NPS help reduce telecom churn?
NPS identifies detractors before they churn. Closed-loop programs that follow up with low-scoring customers within 48 hours can intervene early, resolve complaints, and convert detractors into passives or promoters. Account Experience (AX) ties this feedback directly to revenue risk.
What CX trends are most important for improving NPS in telecom?
Three trends stand out: omnichannel accessibility (minimizing customer effort across touchpoints), contract flexibility (removing lock-in structures that generate resentment), and personalization (customizing the experience to the customer’s context and value tier).
What is "bad profit" in telecom and how does it affect NPS?
Bad profit is revenue earned through practices that damage the customer relationship -- hidden fees, automatic contract renewals, service bundling customers did not request, and punitive early termination charges. These practices inflate short-term revenue while creating detractors who churn and spread negative word of mouth.
Methodology (Questions 18-20)
How often should telecom companies run NPS surveys?
Telecom companies should run transactional NPS surveys after key touchpoints: installation, billing events, support interactions, and contract renewals. Relational surveys should run quarterly to track overall account health, particularly for B2B customers.
What is the difference between transactional and relational NPS in telecom?
Transactional NPS is sent after a specific interaction (a support call, a bill dispute) to measure satisfaction with that touchpoint. Relational NPS is sent periodically to measure overall loyalty. In telecom, both are valuable: transactional NPS catches friction in real time; relational NPS tracks the health of the overall relationship.
How is Account Experience (AX) different from standard NPS in telecom?
Account Experience (AX) ties NPS feedback to account revenue, enabling telecom companies to prioritize detractor follow-up by revenue at risk. Standard NPS treats all responses equally; AX ensures the team responds first to the customers whose churn would hurt most.
Competitive and Strategic (Questions 21-25)
How does telecom NPS compare to other industries?
Telecom has the lowest average NPS of any major industry globally. Consumer electronics average 52; financial services average 44; consumer packaged goods average 41. Telecom’s average of around 24 reflects structural issues rather than temporary service failures.
Can improving NPS reduce telecom customer acquisition costs?
Yes. Promoters refer new customers at no acquisition cost. Detractors churn and require expensive replacement. With a 22% industry churn rate, even a modest NPS improvement that reduces churn by 1-2 percentage points represents significant savings at scale.
How did Free Mobile improve its NPS in France?
Free Mobile eliminated contracts and hidden fees, offering a transparent pricing model that competitors could not easily replicate. The result: over 12 million new subscribers and an 18% share of the French mobile market. The NPS improvement followed from removing the structural causes of detraction, not from adding new features.
What did Sure (B2B telecom) do to improve NPS?
Sure embedded feedback into company culture, securing C-suite buy-in for NPS funding and front-line adoption. Using Account Experience to collect feedback and close the loop across all business sectors, Sure significantly increased retention while UK competitors averaged an NPS of 12.
How can a telecom company start improving NPS quickly?
Three immediate actions: identify the top driver of detractor scores and address it structurally; implement a closed-loop program that follows up with all detractors within 48 hours; and eliminate at least one bad-profit policy (hidden fee, auto-renewal, or forced bundle) that generates avoidable resentment.

Blog Home