


One of the most common FAQs we get is 'What is a good Net Promoter Score (NPS)?'
We've built one of the largest databases of NPS Benchmarks to compare against, but it's important to emphasize that results will naturally vary from business to business and industry to industry — not to mention that survey collection methods and response rates are always different and impact the score dramatically.
In this article, we'll share four approaches you can use to determine if your score is good or not. And we'll recommend what really matters when it comes to driving customer retention.
💡 Takeaway: It matters less what your score is, and more what you do with that information. For example, if you know a high-value customer is an NPS Detractor then you know the relationship needs your immediate attention.
How to Calculate NPS
NPS is calculated by asking customers a single question:
"On a scale of 0-10, how likely are you to recommend our company to a friend or colleague?"
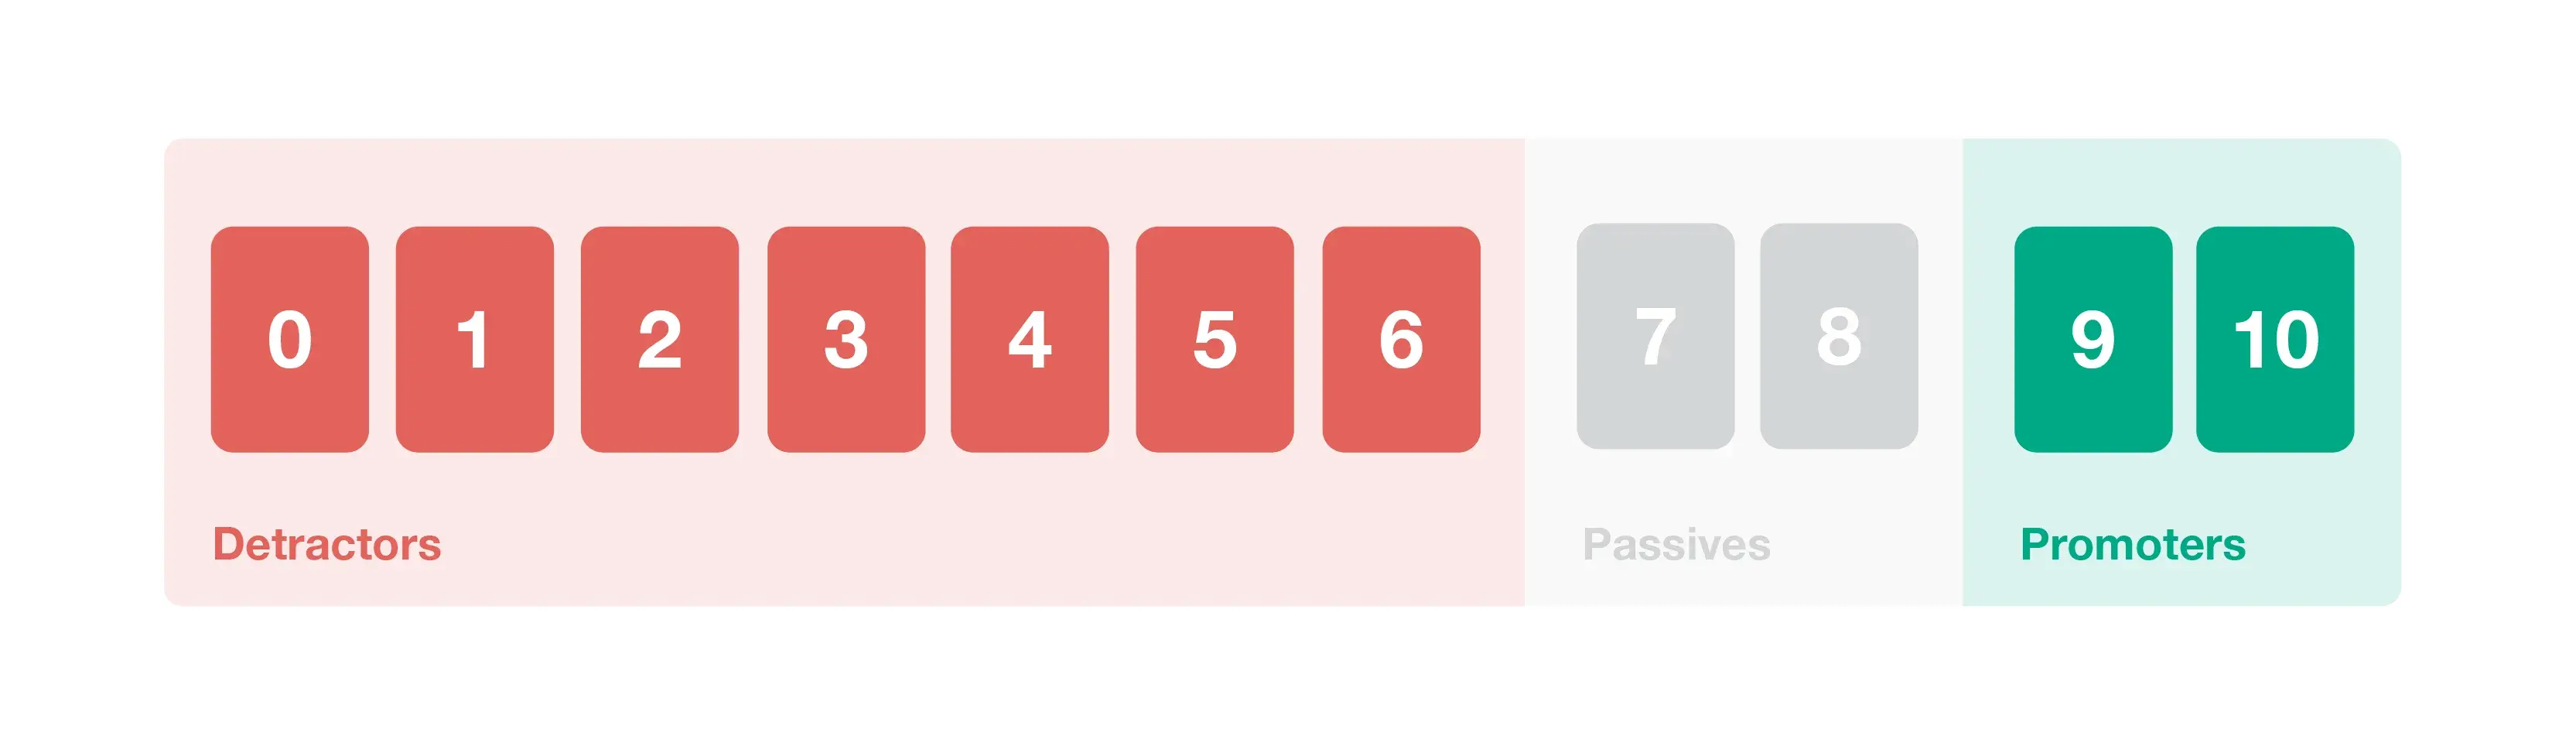
Based on their response, customers are classified into three groups:
- Promoters: providing a score of 9 or 10
- Passives: providing a score of 7 or 8
- Detractors: providing a score of 0 to 6
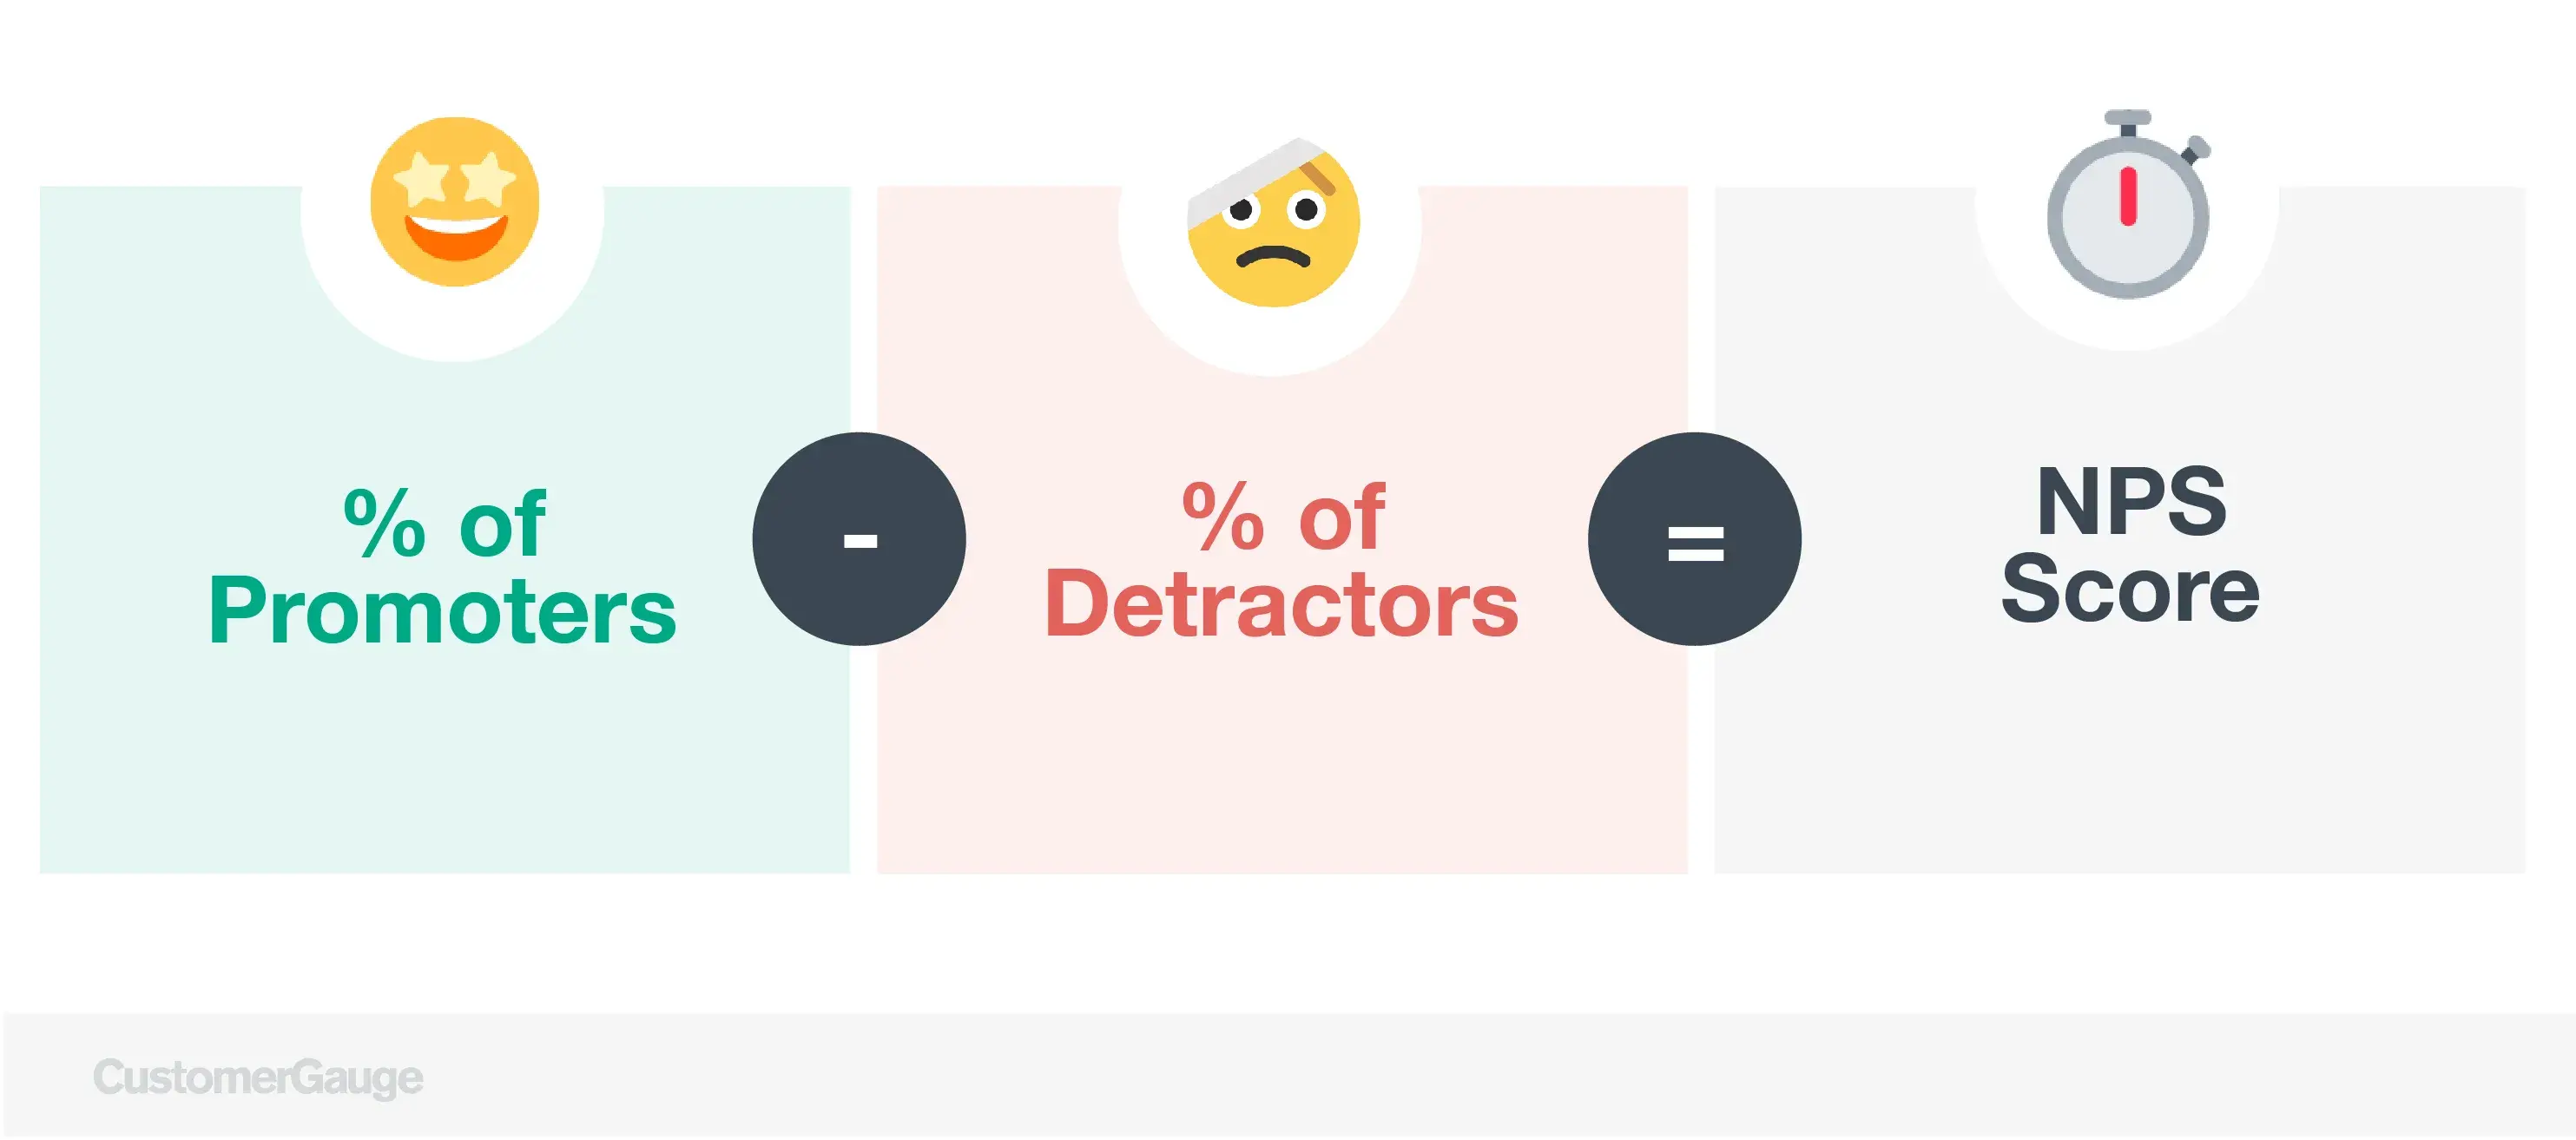
The NPS is then calculated by subtracting the percentage of Detractors from the percentage of Promoters.
The result is a score that ranges from -100 to 100.
What Is A Good NPS Score?
A good NPS is generally considered (by Bain & Co) to be above 50, while scores of 70 or higher are considered exceptional — but you know what we have to say to that? It depends! There are a few different factors you can benchmark your score against to find if your score really is good (see below 👇).
A high NPS indicates that customers are likely to refer your business to others, while a low NPS suggests that improvements are needed to increase customer satisfaction and loyalty.
4 Ways to Discover If Your NPS Score Is Good
While your goal is to get to an NPS score of 100, that's likely impossible for a larger company and is an unrealistic goal to set.
With that in mind, finding the right comparable is critical.
We have four approaches to help you interpret and present your score back to your colleagues. Each provides a slightly different analysis, choose which is right for you — or, if it were me, I'd present all four and explain why the fourth is what really matters.
Let's run through them:
Method 1: Absolute NPS
Absolute NPS uses unqualified NPS scores from all industries as a marker of good or bad and looks something like this:
- If your score is below zero, that's "bad." The majority of your customers are having a bad experience — they're likely not referring you, are open to moving to a competitor at any time, and cost more to serve through additional customer support interactions.
- If your score is 0 to 30, that's "acceptable." Many of your customers have room for improvement in their experience but you're doing something right.
- If your score is 30 to 50, that's "pretty solid." Your product generally delivers on its value and the majority of your customers are so happy they'd recommend you to a colleague — no mean feat.
- If your score is 50 or more, "awesome!" This is where top brands for CX usually sit. You're verging on the unattainable and customer perception is hugely positive.
As you can imagine, this method is lacking somewhat. Firstly, everyone runs their NPS program slightly differently and every industry has different dynamics.
It's hard to compare apples to oranges — you might be top of the telecoms industry but still 50 points beneath Amazon.
Method 2: Relative NPS
Relative NPS leverages competitor benchmarks so you're one step closer to comparing oranges to oranges.
In most annual reports or investor presentations, we see them using a relative comparison. Do a quick Google search and you'll find presentations that show a company's NPS score compared to their industry peers, saying, "Better than them!"
Our annual NPS benchmark report surveyed thousands of companies about their NPS program. Use these industries as a relative benchmark for your company:

With a relative score to compare against, you're getting closer and closer to a comparison that makes sense.
But still, be warned — matching or beating industry benchmarks isn't the goal.
The goal is to serve customers and drive revenue retention. If your largest customers are in the detractor or passive column, your 'Industry-beating NPS score' really just obscures the true problem.
Method 3: Be your own 'What Is a Good NPS Score' benchmark
The most accurate benchmark of improvement is your score last year.
Here’s a little trick companies are rarely aware of that can help them understand whether their NPS is good or not:
Is it growing? It is important to highlight the fact that too many companies treat NPS as a “vanity metric”— focusing on the number, rather than reflecting on the story it tells about the health of the customer relationship.
The Net Promoter Score by itself is largely meaningless unless you work on improving it.
Assuming you survey customers every 6 months, a good NPS is one higher than the score you received during your last survey campaign.
“It’s not the score that matters; it’s what you do with it to make promoters that really counts.” - Fred Reichheld, Founder of NPS, Bain & Company
As such, the power of Net Promoter System is not only on measuring customer loyalty.
Instead, the beauty of NPS is the ability to quickly act on customer insights and grow revenue through referrals and upsells.
Method 4: Forget the score itself, let revenue dictate success
It matters more if your large customer accounts are detractors.
The most concrete, growth-focused understanding of Net Promoter comes when you tie your NPS survey results to revenue.
Let's take an example. Imagine you survey all your customers, calculate your NPS score and you get a score of 80. Wow, pretty high compared to others in your industry!
Your boss takes a look at your NPS score stats and says, "What does this mean? What is a good NPS score?" You say, "80 is fantastic. Amazon's only got 69."
And, then...your largest customer, responsible for 20% of your revenue, leaves you for a competitor. Your boss immediately asks how that's possible given your leading customer experience.
BAM. Not good. This exact story happened to one of our SimpleWays before they started using our NPS Software.
Without digging deeper into exactly WHO is filling out your NPS surveys, you have a large blind spot. This is why you must tie revenue to your NPS scores and find out the answer to the most important question:
"What proportion of our current revenue comes from passives or detractors?"
(P.S. reach out to our sales team to find out how our product does that for you).
How to Achieve a Good NPS Score
There are three things that everyone should know about Net Promoter Score, and most don't.
Deep dive: How to improve your NPS system
1. To quote our VP of Education (Cary Self), "NPS is not a research tool, it's an action tool."
The beauty of the Net Promoter System is that it's simple. You can understand your customers and overall business health with just a handful of questions, asked quarterly.
However, most companies fail to take adequate action on the results of their NPS feedback collection. Analysis paralysis is a reality for most and actionable customer insights usually never find their way into the right hands.
Failing to set up a process in which your team acts quickly to both positive and negative NPS scores is a total waste, not to mention customers' problems remain unaddressed.
NPS comes into its own when used as a growth mechanism. Your NPS scores help:
1) Identify customers at risk of churn (it's 5x cheaper to retain customers than acquire new ones).
2) Identify your champions (who are usually open to up-sales and referral business opportunities).
The magic happens not in the identification of detractors, passives and promoters, but in how you use that knowledge to secure business and activate referrals.
Our customers are often leaders in customer experience, sales enablement, customer operations, and business transformation.
If that's you, you need to make sure your teams act with speed and precision to close the loop.
When you survey your accounts and receive their feedback, you must act quickly. The opportunity to retain detractors or to activate (upsell or get a referral) from a promoter diminishes as more time passes.
2. NPS should be focused on customer revenue
Like in the SimpleWays story we told above, it's quite possible that the majority of your business revenue comes from a minority of large, affluent accounts (In most companies the Pareto 80/20 principle applies).
With that in mind, it makes sense to allocate your resources to customers in order of their importance. If every customer account isn't adding equal value, there's no reason you should treat them that way.
Tying each NPS survey result to the annual value of that customer always provides some interesting results.
For example, you could find that 25% of your revenue currently comes from accounts labeled as detractors. Furthermore, if you use follow-up questions to identify which customer touchpoints are driving NPS scores, it'll be easy to know what issues to prioritize fixing.
In an NPS software like ours, you'll receive alerts when a proportionately large customer is a churn risk.
And, my personal favorite feature, you'll understand the value of each CX driver. We'll let you know which drivers are responsible for the most "at-risk revenue."
Read more about monetizing NPS in our free book on Account Experience here.
3. NPS survey design is KEY to your success
Our deep experience in B2B Net Promoter Systems has brought us to these two conclusions:
- You must survey multiple layers of decision-makers and users. Within each customer account, there is more than one decider of your fate. If all of the frontline, mid-level, and senior C-suite are influential, so survey as many stakeholders as possible. Someone isn't filling out the survey? The absence of engagement is a signal itself. Time to worry.
- Survey frequency has an impact on the retention rate. Indeed, we have evidence that companies that survey customers quarterly have the highest average retention rate.
Read more of our NPS survey design best practices here.
Our customer success and education teams work extensively with B2B customers to improve their Net Promoter programs.
You can learn more about NPS in our Academy video courses here.
How Account Experience Helps B2B Companies Get a Good NPS Score
Firstly, I recommend downloading our white paper on AccountExperience (AX).
Our AX methodology is a tried and tested blueprint that takes you from customer feedback to revenue growth. Building a platform around the AX methodology has earned us the #1 ranking by Gartner for B2B voice of customer platforms.
In short, if you want to achieve a good NPS score, and actually make the metric meaningful for your business' top and bottom line, then AX is the answer.
AccountExperience, or Monetized Net Promoter, is the process of operationalizing NPS survey feedback and scores so that you can:
- Identify which of your accounts are about to churn. E.g. receiving advice like ‘based on your recent survey round $1.6m in revenue is indicated to be at-risk of churn. This includes your largest account with an ARR of $1m.’
- Identify referral opportunities. E.g. receiving advice like ‘your customer, XYZ Corp, has consistently given you a score of 9 or 10. It’s time to ask them for that referral.’ (Learn how SmartBear got $6m in referrals using AX).
- Identify which of your accounts are likely upsell opportunities. E.g receiving advice like ‘users at all levels of XYZ Corp’s organization are extremely happy with your service. Your next review meeting is a good chance to focus on what’s next.’
- Identify the drivers of bad NPS scores so you can improve them.
A monetized net promoter score is the next step after collecting NPS feedback: operationalizing.
To actually stand a chance of improving your NPS score, you need to listen to each piece of feedback and take action upon it: either you talk to your unhappy customers, apologize and fix their issue, or you talk to your happy customers, celebrate together, and ask for referrals.
Account Experience is the methodology that helps you make the shift from ‘NPS is a research tool’ to ‘NPS is a growth driving tool’.
To learn more about Account Experience and see our product live contact our team for a demo!
About the Author