28 Top Consumer NPS Benchmarks: A 2025 Guide
by Ian Luck
In the B2C world, loyalty has become increasingly difficult.
Retail is experiencing a shake-up like no other; eCommerce has made switching costs extremely low for consumers.
The B2C space has always been emotion-driven. Low-cost purchases, often attached to the buyer's identity, make decisions fast and spur of the moment.
This lies in stark contrast to B2B, where more people are involved, buying decisions are complex, and much more (money and reputation) is at stake. A greater return, but a greater risk, too.
A key nuance, especially in the FMCG space is that most often brands like Coca-Cola HBC, Heineken, and AB InBev aren't selling directly to the consumer.
They're B2B2C. Which means managing thousands of channel partners across the globe who make regular, large purchases to fill their pubs, stores, or retail units.
In that context, brands need an adapted Net Promoter System to stay on top of their customer relationships. In B2C, each customer represents a small fraction of your revenue, whereas in B2B2C each churning customer could be a significant loss.
In this guide
The essentials
- What actually is NPS in B2C?
- What's the difference between B2C and B2B NPS?
- NPS & Consumer Packaged Goods (CPG) (B2B2C)
- How to run an NPS survey (best practices)
- How to calculate NPS
NPS Benchmarks
- How to analyze your NPS results — average scores for your industry
- 28 NPS scores from famous consumer companies (skip ahead)
- Three consumer brands and their NPS programs
- Future consumer NPS trends
What is a Net Promoter Score (NPS) in B2C?
Net Promoter Scores (NPS) are a metric used by top consumer brands to determine how likely customers are to make a repeat purchase or recommend a product to friends, family, and colleagues. Consumer NPS surveys usually ask respondents to score products on a rating scale of 1-10.

Questions on NPS surveys are worded simply to minimize confusion and garner the largest amount of actionable quantitative data possible. A typical example would be:
“How likely are you to recommend [product or company name] to a friend or colleague?”
The best NPS surveys also use an open-ended follow-up question to collect qualitative data that helps identify specific problems. This helps brands to pinpoint changes required to improve their products, customer service, and organizational processes, etc. Examples include:
Please provide a reason for your score?
What is the primary reason for your score?
How can we improve our service?
What did you like most/least about[product, service, company name]?
What features of [product, service, company name] did you value most/least?
What's the difference between B2C NPS Scores and B2B NPS Scores?
Essentially, the purpose and benefits of conducting a business-to-business and consumer NPS survey are the same. The main difference lies in how the surveys are conducted. Consumer NPS surveys are more likely to be transactional, whereas many B2B surveys will be relational.
Not sure what the difference is? Transactional NPS surveys are sent following a particular event, like the purchase of a product. On the other hand, Relational NPS surveys are sent periodically to measure long-term satisfaction.
In the B2B space, where it's critical to measure account health overtime to prevent churn and identify growth opportunities, we suggest running quarterly NPS surveys which can be discussed in your next meeting with the customer.
In the B2C space, transactional surveys can be useful in gathering feedback on a particular touchpoint so that it can be improved next time. It's less about the individual relationship—although we recommend closing the loop—and more about continuous improvement.
NPS & Consumer Packaged Goods: A New Approach
The CPG industry is complex. Large players often have thousands, if not millions of sales partners and channels to manage.
CPG companies still accelerating their market share and remaining competitive are deploying innovative CPG experience technologies. One of which is Net Promoter Score, well, a version adapted to fit B2B2C account management operations.
The key principle behind the modern CPG experience?
Collecting, analyzing, and acting on customer feedback in real-time. Competitive CPG players deploy a channel feedback strategy that turns the customer's voice into an operational mechanism.
It's no longer a 'once a year' collection effort, it's a continuous process of automatically listening and acting on customer feedback.
By removing as much gut feeling from account management as possible, CPG experience technology tackles churn and identifies happy customers with clear signals of being an upsell opportunity.
We've written the book on this methodology, AccountExperience (AX), for CPG companies.
With some work, you can turn thousands of accounts and account managers into a smooth machine without leaking holes.
How to run an NPS survey and collect consumer data
There are many software services available to help you design, create, and implement your survey. It’s just a matter of finding the one that’s right for your brand. There are two main options. You can either host a survey on your website or send it out in-app or via email.
CustomerGuage offers a full range of NPS resources, including field guides, tool kits, eBooks, podcasts webinars, and whitepapers. So, we recommend you check those out before you get started to make sure you’re taking the approach.
With 15+ years of experience in helping brands collect, collate, and analyze their NPS data against consumer NPS benchmarks, we know first-hand how to design effective surveys that will get the best results. Our services include software that helps you:
Create actionable surveys
Choose titles and descriptions that attract consumer clicks and responses
Write effective questions and follow-up questions
Analyze quantitative and qualitative data
When should you run an NPS survey?
It’s best to send a transactional survey as soon as possible, otherwise, the customer’s experience won’t be fresh, which will affect the accuracy of your NPS. Consumer surveys can be sent based on touchpoints as well as product purchases.
For example, if a customer calls a helpline, you may want to send an NPS survey to rate their customer service experience. In this instance, it pays to be cautious about sending feedback requests too often.
Let’s face it, a customer who calls a support center two or three times a week isn’t going to appreciate being surveyed after each interaction.
NPS survey best practices
Our best NPS survey advice is to keep it short. At CustomerGauge, our best NPS survey results are based on asking just three questions. Shorter than this may produce higher response rates, but asking just one or two NPS questions will produce data that has limited actionability.
Any longer than four or five questions, and you’re likely to get inaccurate answers due to survey fatigue. Other best practices include:
Personalization - People want to be seen as individuals, so utilizing software to personalize your surveys is essential in generating data that forms reliable consumer NPS benchmarks.
Visual elements - Customers can be just as easily turned off by how the survey looks as by a poorly worded question. Always include brand assets like colors, logos, and fonts.
Reminders - Setting automated reminders will improve your response rate.
Build a continuous feedback loop - Use a tick-box to request permission for further follow-up so you can gather more in-depth feedback.
Test test test! - Internal testing provides valuable employee feedback and allows you to correct formatting errors and check the survey runs smoothly before sending it to customers.
Writing an Effective Questionnaire
How you phrase a question can significantly impact the quality of data you collect. The phrasing of your questions should change depending on whether you’re collecting feedback about a product or a consumer touchpoint. Take this generic NPS question:
How likely is it that you would recommend [company name] to your friends and family?
Now let's look at a couple of alternatives: the first for product feedback and the second for a customer touchpoint experience.
Now you’ve been using [product] for [length of time], how likely are you to recommend [company name] to your friends and family?
Based on your experience calling [ company name] about [product], how likely are you to recommend us to your friends and family?
See the difference?
How to Calculate NPS for Consumer Companies
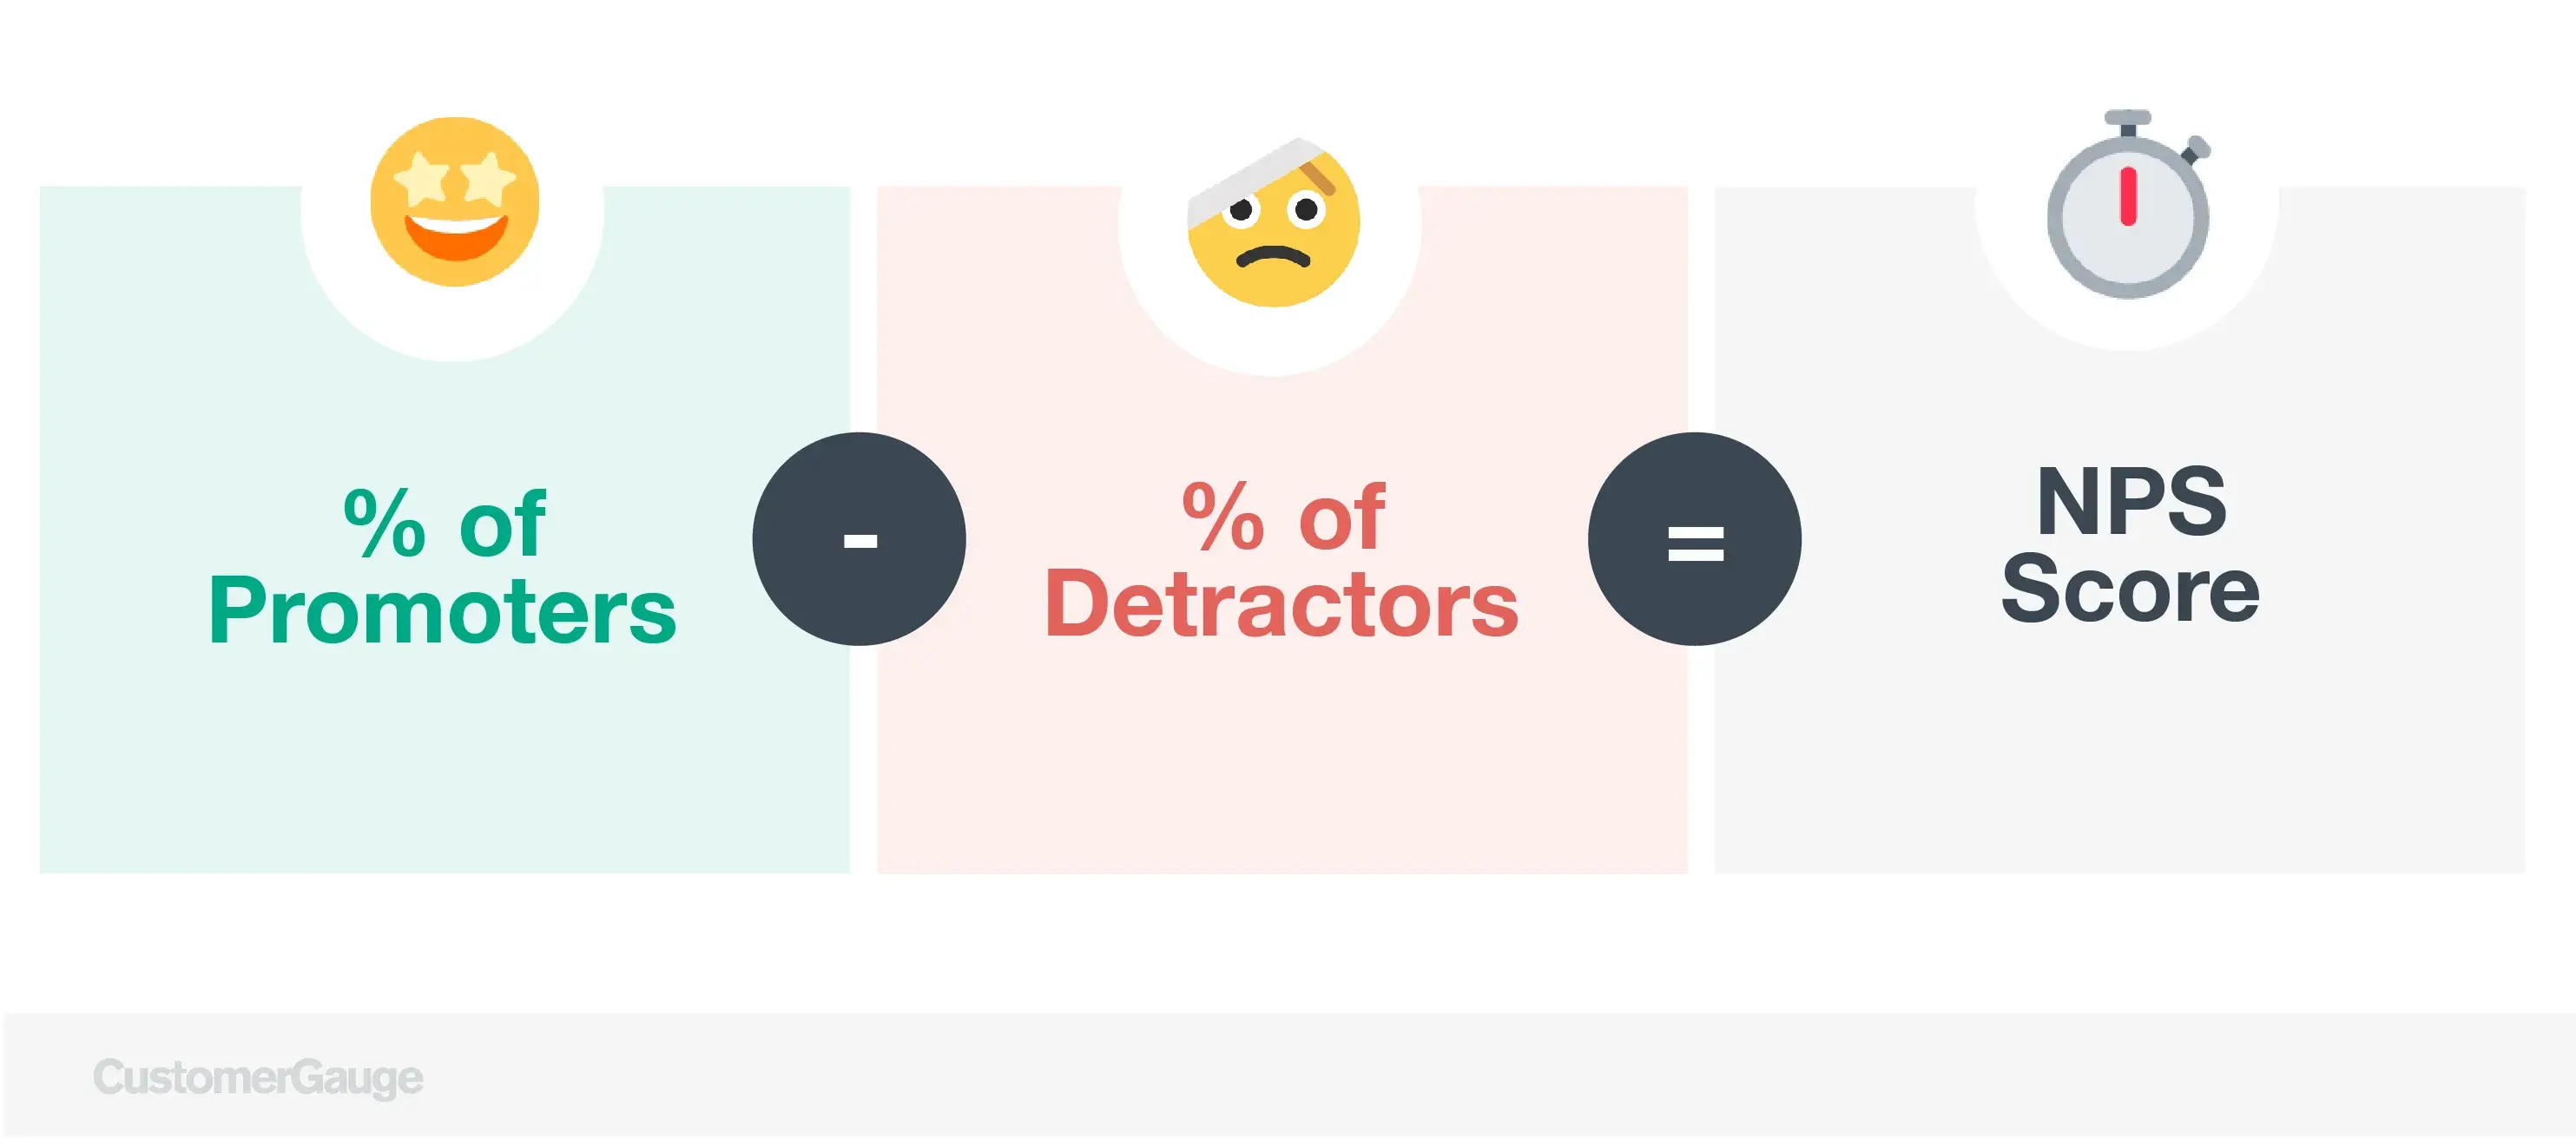
Consumers who respond to your survey are separated into three categories:
Promoters – Those who give ratings of 9 or 10
Passives – Those who give ratings of 7 or 8
Detractors – Those who give ratings of 0-6
To calculate your net promoter score, simply discount the passive results and subtract the percentage of detractors from the percentage of promoters. For example, If 60% of respondents are promoters, 20% are passive, and 20% are Detractors, your net promoter score would be 40.
Based on the global NPS standards, any score above 0 is good because that means you have more promoters than detractors. Scores above 50 are classified as excellent, and an NPS of 70 or higher is considered world-class.
Want to calculate your NPS score quickly and without confusion? We made this handy NPS calculator in Google Sheets to help you do just that!
Net Promoter Score Scale: Promoters
Promoters are customers who are willing to recommend you to others and bring in more potential buyers. They’re also the ones most likely to leave good reviews, and because they already feel valued, they are typically open to hearing from you more often.
Net Promoter Score Scale: Detractors
Detractors are unhappy customers at risk of churn and leaving bad reviews, etc. Dissatisfied customers are bad for business. Effective consumer NPS surveys identify unhappy customers early, allowing for intervention before they slow your growth.
Net Promoter Score Scale: Passives
Just because passive responses don’t count toward calculating NPS scores doesn’t mean they are insignificant. Passives are on the fence and need to be encouraged to become promoters rather than detractors who may ditch your products in favor of a competitor.
How to Analyze Net Promoter Score Results
The golden rule is never to compare your NPS results with sectors outside of your niche (there are four ways to determine if you have a good NPS score).
Different sectors, by their very nature, will achieve different scores. For example, consumer tech NPS scores for products like laptops, tablets, and smartphones will score differently to companies selling utilities. These, in turn, will differ from net promoter scores for consumer packaged goods and fashion brands, etc.
To give you an idea of current norms, here are some examples from our latest NPS Benchmark Guide breaking down the average NPS score by industry:
Consumer electronics - 52
Software - 36
Fashion - 40
Financial services - 44
Utilities - 58
Bear in mind that there will always be some debate over top consumer brand NPS scores. For example, last year PCMag found that Apple's NPS score was 65, whereas Satmetrix came up with a score of 57.
At CustomerGauge, we took the average across multiple of the latest sources and products and found that Apple's NPS score was 61.
When it comes to analyzing your open response data, these are the best practices to follow:
Categorize - By organizing feedback into topics, you can pinpoint the areas most in need of improvement.
Use Demographics – Separating responses based on respondent location, age, gender, income, etc., helps you better understand your promoters and detractors.
Record Sentiments – Tag comments as positive, negative, or neutral to learn more about potential shifts between promoters, detractors, and passives.
Measure Changes – Compare the findings of each survey. Did the changes you implemented based on your last Consumer NPS questionnaire pay off? And if not, why not?
28 Top Consumer NPS Scores for 2024
| Company | NPS Score |
|---|---|
| Heineken | 76 |
| Anheuser-Busch InBev | 56 |
| Henkel | 46 |
| Coca-Cola | 39 |
| Danone | 39 |
| Adidas | 39 |
| Unilever | 38 |
| 3M Co. | 37 |
| Nike Inc. | 36 |
| Victoria's Secret | 36 |
| Philip Morris International | 33 |
| Kraft Heinz | 31 |
| Procter & Gamble | 29 |
| Christian Dior | 26 |
| PepsiCo | 20 |
| Tyson Foods | 18 |
| Nestle | 17 |
| Mondelez International | 15 |
| JBS | 14 |
| Dior | 0 |
| British American Tobacco | -3 |
| Prada | -5 |
| Gucci | -6 |
| Chanel | -9 |
| Rolex | -12 |
| LVMH | -15 |
| Giorgio Armani | -27 |
| Rolls Royce | -47 |
Want more CX benchmarks like these? Download the most comprehensive CX benchmarks report on the planet here.
How three top consumer brands use NPS
To gain a broader understanding of how top consumer brand NPS scores help drive improvements in growth and performance, let’s look at some specific examples.
Just Eat
Just Eat is becoming an increasingly global force focused on giving takeaway businesses and restaurants an online platform to deliver directly to consumers. Currently available in 23 countries, Just Eat strategically used NPS scores to achieve commercial excellence by focusing on relationships with their restaurant and takeaway partners to improve the overall end-customer experience.
By creating an account experience with each food outlet, Just Eat account management teams were able to use their NPS to identify things that work well, and also overcome complexities across various markets.
After all, a service like Just Eat isn’t a copy-and-paste model that works in every country without considering differences in:
Cuisine and menus
Packaging
Delivery logistics and delivery fees
Loyalty programs
Promotional tools
In-house software and POS
The functional reporting and transparency provided by CustomerGuage NPS support helped Just Eat to create ambassadorship among food outlet clients. The process of getting businesses directly involved in detractor feedback and giving them a voice improved NPS scores and consumer satisfaction across the board.
“We focus on detractors to improve retention as a primary focus. But there are definitely opportunities coming up where we hope to put more emphasis on ambassadors by combining marketing, product, and tech to create a customer community and a set of ‘local heroes’ that can provide even more insights to drive innovation and improvement.”
—Lucinda Anderson, Commercial Excellence Manager, Just Eat Takeaway.com
Incredibly, the Just Eat team achieved a 97% closed-loop rate on 98% of detractors within 48 hours, netting them a well-deserved CustomerGauge Account Experience Award.
AB InBev
Ab InBev is one of the largest consumer packaged goods manufacturers in the world, generating upwards of $70Billion in revenue. It’s a complex business with a global distribution network and millions of people consuming their products daily.
Back in 2018, the Ab InBev team realized they had a problem. They couldn’t accurately manage service levels across their global network. They had plenty of great people with years of experience who were happy to generate ideas. But they had no data.
“Without data, all you have is opinions. We needed more.”
—Luiz Gondim, Sr. Global Director of Contact Strategy,
Ab InBev rolled out CustomerGauge Account Experience across 27+ global markets to start collecting feedback from their distribution network. Using a roadmap that reached out for feedback 2-3 times per year, they used their NPS cycle to track and describe customer experiences at each stage of their journey.
By gathering feedback from each stage (presales support, relationship building, problem resolution), the consumer goods giant hoped to both win back business from detractors and encourage repeat purchases by promoters.
The NPS survey used localized content and consisted of just one NPS question and one open-ended follow-up. The whole survey took just 3-5 minutes to complete.

On the first pilot, the NPS returned a score of -13. Not great. But, now Ab InBev had the data and feedback they needed to drive improvement. The brand continued to measure progress using NPS across four main drivers:
- Company
- Product and brand portfolio
- Consumer touchpoints
- Customer service and support
Want to guess what AB InBev’s NPS score is these days? It’s 56, and AB InBev is ranked 9th in the world for food and beverage brands.
If that isn’t definitive proof that NPS works, we don’t know what is!
Heineken
Heineken is best known as the consumer brand that brews awesome beer with the famous green and gold label. While the company does market to the general public, much of its business is conducted with bars.
In dealing with vendors and resellers, Heineken takes a customer-first and customer-centric approach. That means going the extra mile to ensure that bars, restaurants, and other resellers have the opportunity to communicate feedback.
So, when Voice of Customer Program Lead, Stephan Visser, asked the following question, NPS seemed the logical answer.
“What can we do to improve relationships with bars so that they stay happy with us so that we keep relationships with them, and so that they keep selling our beer towards the end consumers?”
Today, NPS has become a core metric for Heineken in improving the customer journey. By creating a continual process for following up with customers, the brand ensures a continual dialogue and gains valuable insight over time.

A key priority for Heineken is not just to follow up with detractors but also with promoters. The company works on the premise that the conversation shouldn’t end when customers are happy. They want to keep learning so they can deliver even better experiences.
By leveraging NPS insights to close the loop with detractors, Heineken was able to identify common trends of dissatisfaction and use that information to save clients. Following up with promoters helped build better relationships with happy clients, leading to even more sales.
Ultimately, Heineken was able to take its NPS data and use it as a method of growth, even when bars were shut down during COVID-19!
Now that’s impressive.
🎤 Watch Heineken share more CX insights on-stage at CustomerGauge's B2B VoC Conference, Monetize!
Consumer NPS Trends Over Time
Top consumer brands must always have their fingers on the pulse of the latest consumer trends to maintain and increase their NPS scores and revenue. We recommend downloading our NPS & CX Benchmarks Report for the most detailed analysis.
In the meantime, here are some of the biggest consumer trends that companies will need to account for in 2024:
Climate change - Green lifestyles are here to stay, and companies must rise to the challenge of increased consumer demand for carbon-neutral products. In their annual Consumer Global Trends Report, Euromonitor stated that 78% of professionals think that climate change will impact consumer demand this year.
Democratized money management - In the continuing crypto boom, brands need to collaborate with financial services providers to facilitate alternative forms of payment that build and maintain an integrated experience for shoppers.
A focus on inclusion - Acceptance, self-care, and inclusion are modern-day consumer priorities, especially for millennials and Gen Z. According to Forbes Magazine, 52% of consumers consider a company’s values when making a purchase.
The thrift economy – The consumer market mindset is transitioning from ownership to experiences, and thrifting is firmly on-trend. Businesses need to prioritize circular economy initiatives that please the thrifty consumer mindset if they don’t want to lose out to peer-to-peer purchasing models.
Digital seniors - The aging population has become more digitally savvy during the COVID-19 pandemic. Businesses that focus on simplifying their technologies to capture this market will see higher satisfaction and engagement and lower churn rates.
Frequently Asked Questions About Consumer NPS Benchmarks
1. What is a good NPS score in consumer industries?
A good NPS score in consumer industries is typically 50 or higher. Scores in the 60–70 range are considered excellent for most B2C brands.
2. What’s the average Net Promoter Score for B2C brands?
The average NPS for B2C brands varies by sector but generally falls between 30 and 40. Top performers can exceed 60.
3. What NPS should consumer companies aim for?
Consumer companies should aim for an NPS of at least 50 to be competitive. Brands with NPS above 60 are seen as customer experience leaders.
4. What is the NPS benchmark for consumer products?
The NPS benchmark for consumer product companies typically ranges from 30 to 45, depending on the category (e.g., food, electronics, beauty).
5. What is the typical NPS for consumer goods companies?
Consumer goods companies often report NPS scores in the 35–50 range. Brands focused on direct-to-consumer sales may achieve higher scores.
6. What’s the average NPS in retail?
Retail industry NPS averages around 45, with top-tier brands reaching 70+, especially those focused on omnichannel customer experience.
7. How do luxury brands perform on NPS?
Luxury brands tend to perform well, often scoring 60–75, as personalized service and emotional brand loyalty drive high promoter levels.
8. What’s the NPS score for Amazon or Walmart?
Amazon has historically maintained an NPS of 60–70, while Walmart typically scores between 30 and 40, depending on the service channel.
9. What’s the benchmark NPS for e-commerce companies?
eCommerce brands average between 40 and 55, with leaders like Chewy and Zappos often scoring above 70 due to customer-centric policies.
10. What is a strong Net Promoter Score in travel or hospitality?
A strong NPS in the travel and hospitality industry is above 50, with companies like Airbnb and Ritz-Carlton often exceeding 60.
11. Which consumer brands have the highest NPS?
Brands like Apple, Netflix, Costco, Tesla, and Trader Joe’s regularly rank among the highest, often with NPS scores above 70.
12. What’s Apple’s NPS compared to Samsung?
Apple typically scores an NPS of 60–75, while Samsung's NPS ranges from 45 to 60, depending on the product category.
13. Does Nike have a high Net Promoter Score?
Nike has reported NPS scores in the 60s, reflecting strong brand loyalty, particularly in its direct-to-consumer and digital segments.
14. What is Costco’s NPS score?
Costco consistently ranks among the top retailers with an NPS in the 70–80 range, driven by value, trust, and customer satisfaction.
15. How does Target rank for customer loyalty (NPS)?
Target’s NPS generally falls between 45 and 60, depending on the region and channel, reflecting solid loyalty among value-conscious consumers.
16. How is NPS used in consumer brand strategy?
NPS is used in consumer brands to track loyalty, diagnose friction in the customer journey, and prioritize product or service improvements.
17. Why do some consumer brands have low NPS?
Low NPS scores often result from poor service, inconsistent experiences, product quality issues, or lack of brand trust.
18. How do top consumer brands get high NPS scores?
Top brands achieve high NPS by delivering consistent quality, fast support, personalized experiences, and emotionally resonant branding.
19. What factors affect NPS in B2C markets?
In B2C markets, NPS is influenced by product quality, customer service, value for money, ease of use, and emotional brand connection.
20. Can I improve my consumer NPS without changing price?
Yes. Brands often improve NPS by streamlining customer support, enhancing product experience, and increasing personalization, without adjusting pricing.
21. What’s the average NPS for consumer electronics?
Consumer electronics brands average 40–55 for NPS, with top-tier brands like Apple and Bose often scoring above 70.
22. Which tech companies have the best NPS scores?
Tech leaders like Apple, Adobe, Google, and Tesla rank among the highest with NPS scores above 65, due to innovation and UX.
23. Is 70 a good NPS for a phone company?
Yes, an NPS of 70 is considered excellent in the telecom and consumer tech space and indicates strong customer loyalty.
24. What’s the NPS for Netflix or Spotify?
Netflix typically scores around 60–70, while Spotify’s NPS ranges from 40 to 60, depending on the region and subscription tier.
25. How does Tesla rank in NPS among consumers?
Tesla often achieves NPS scores of 70–80, placing it among the most loved consumer tech and automotive brands.
26. How do I benchmark my NPS against top B2C brands?
You can benchmark your NPS using industry reports or databases like CustomerGauge Benchmarks, comparing by sector, region, and business model.
27. What is considered a bad NPS in consumer markets?
An NPS below 0 is considered poor in B2C sectors and indicates that detractors outnumber promoters, signaling a need for CX improvements.
28. How often should a consumer brand track NPS?
Most consumer brands track NPS quarterly or after key touchpoints like purchase or support interactions to monitor trends in real time.
29. What’s the top quartile NPS in B2C industries?
Top quartile consumer companies typically have NPS scores of 65 or higher, placing them in the top 25% for customer loyalty.
30. Can I use consumer NPS benchmarks to set loyalty goals?
Yes. Comparing your NPS to industry benchmarks helps you set realistic loyalty targets and prioritize improvement initiatives.
Blog Home


