


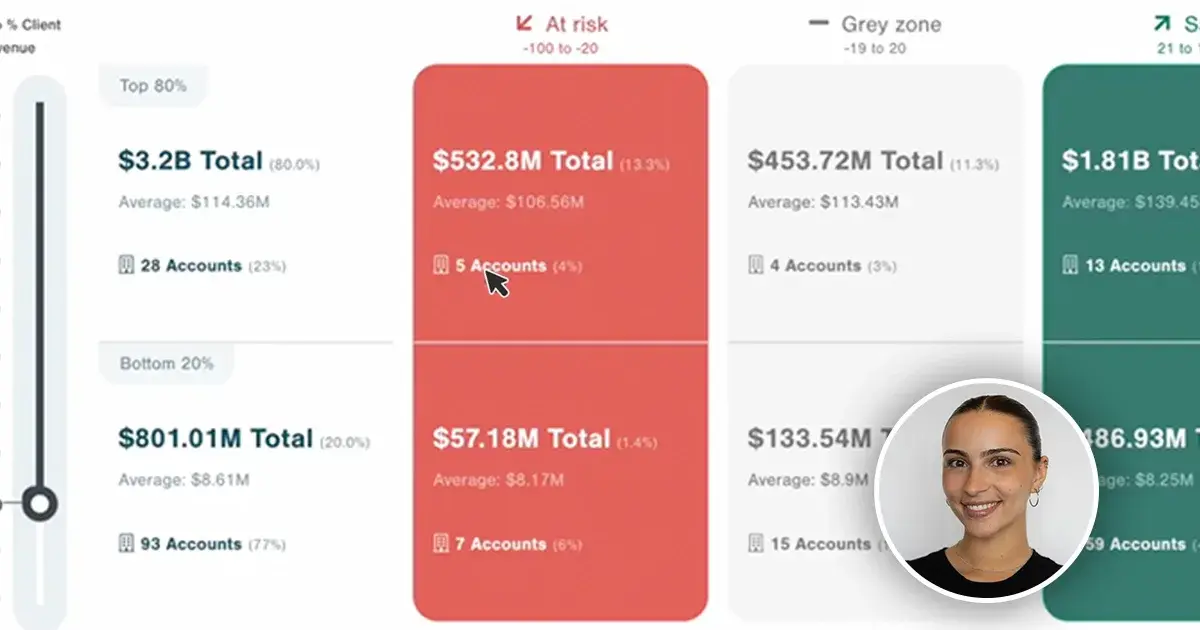
End-to-End B2B Account Management
Track relationship health and turn data into actionable strategies for growth.
 Platform Capabilities
 Only With CustomerGauge
 The B2B Experience Platform
 By Industry
 Pick a Date
Track relationship health and turn data into actionable strategies for growth.
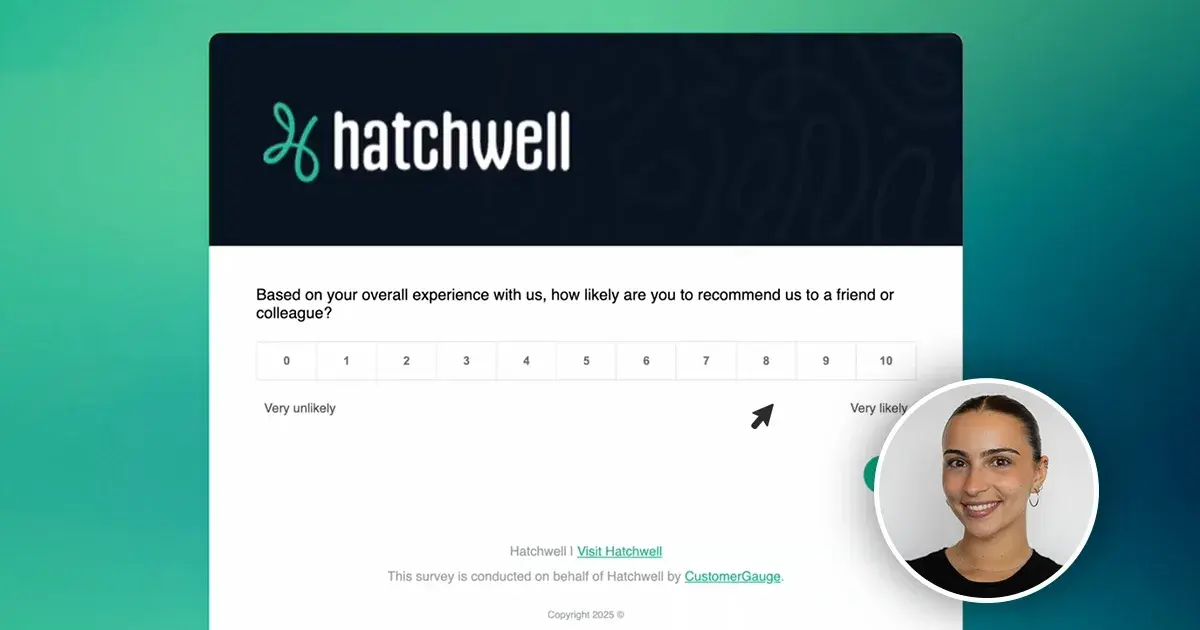
Boost your CX program’s impact with intelligent survey design and personalized outreach.
CustomerGauge is laser-focused on helping you monetize B2B customer feedback.

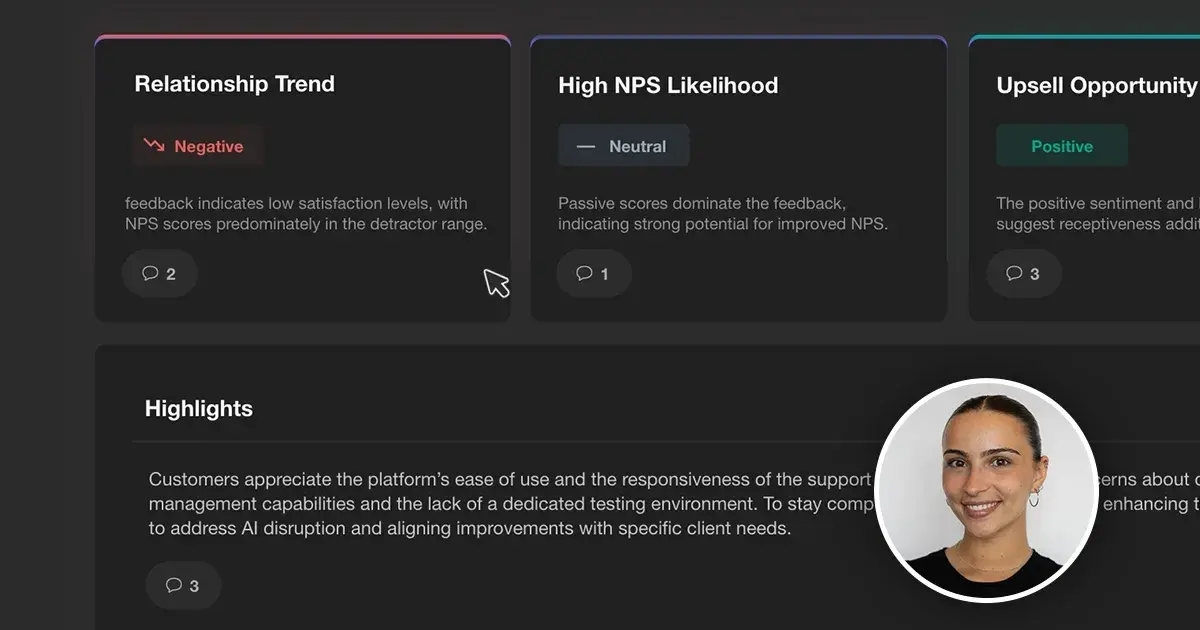
Scalable reporting, fast follow-up, predictive analytics, and more.

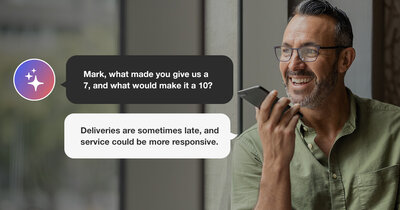
Frontline teams resolve issues more efficiently and strengthen relationships quicker with Gaige AI.
Eliminate data silos and seamlessly integrate with your CRM, helpdesk, and ERP.