


Introducing CustomerGauge 4.0! Like a proud parent parading our child’s 1st place prize, we’re happy to brag about our newest release, which we began rolling-out yesterday.
This new release involved 18 months of planning and engineering. During that time, we listened closely to hundreds of customers to understand how they used customer feedback and shared Net Promoter information around their company. It was clear that they loved the way that CustomerGauge gave them real-time data in a concise view, but the ability to customize dashboards was still at the top of their priority lists.
With that in mind, this roll-out also includes the launch of the all-new Report Hub—a highly configurable reporting feature that offers reporting for NPS, customer satisfaction, customer effort score, retention, churn and more all inside the CustomerGauge application. Over the last year, we’ve been preparing the new Report Hub through beta-testing and fine-tuning. We are excited about the new unique features that will help companies measure retention—something we like to call “Monetized Net Promoter”.
Here’s some of the exciting features offered as part of this launch.
UI Refresh
In 4.0, a new UI will be carried through to the Delivery Manager, Integrations, Drivers Editor, Account Success, Account Overview and the Report Hub. This UI refresh will include:
- A fresh, modern look and feel
- New loyalty colors
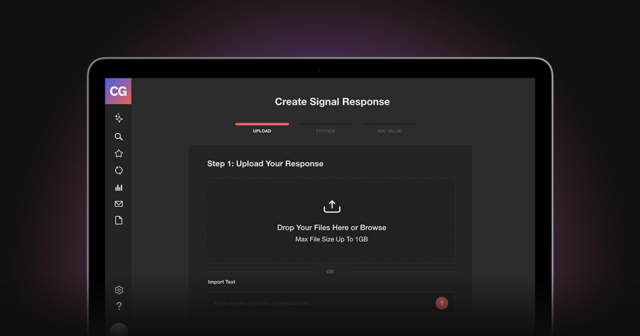
- Fully responsive reporting capabilities for desktop, tablet, or smartphone—adapting to any platform or browser
[caption id="attachment_19956" align="aligncenter" width="500"] It's a new responsive user interface[/caption]
Enhanced Widgets, Multi-Select Filtering, and More
The Report Hub allows customers to define and create their own reports for every role, unit, product or touchpoint, allowing you to create reports tailored to your organization’s needs.
Within the Report Hub, you can pick from an extensive list of widgets, with more than 30 reporting widgets and metrics at your disposal, including pie charts, bar graphs, NPS gauges, table summaries, comment widgets and more. In addition, all the widgets are highly configurable in size, reporting metrics, widget specifications and also come with multi-select filter options. These multi-select filters allow you to slice-and-dice data to easily segment information for your reporting needs.
Other reporting capabilities are also available. Including the ability to:
- Create multiple real-time report collections of your choice—assign report contributors and set viewing permissions
- Make comments anonymous, set up profanity filters, show translations or order by loyalty
- Set up any report collection as a report on the main menu to be used by all users
- Have reports automatically emailed to key contacts on daily, weekly or monthly basis
[caption id="attachment_19959" align="aligncenter" width="500"] New responsive Report Hub with 30+ widgets[/caption]
KPI Dashboard—Turn NPS into High Retention
We all know that a detractor is more likely to leave but few companies measure if they do … especially in their Net Promoter solution. Combining Net Promoter data with retention data will tell you why customers leave, the revenue loss of every churn driver, who is likely to leave next and much more. In other words, you’ll become a fortune-teller of churn, with the ability to change the outcome.
With CustomerGauge’s new reporting widgets you can create your own retention reports and track coverage, engagement, account retention rate, account churn rate and more (something no one else in the NPS marketplace is doing).
[caption id="attachment_19957" align="aligncenter" width="500"] New Enterprise-Level Campaign Manager system: email and SMS editor, survey builder and rules manager[/caption]
Role-Based Dashboards
Our new role-based dashboards allow you to configure and create unique dashboards for every person in your company. You can choose from more than 30+ reporting widget options to create that perfect dashboard for your users to use.
Every role will have their own unique view of the data:
- Frontline will be able to see feedback from relevant touch points
- Customer Success Managers can see relevant customers, their scores and feedback
- Managers can track product across units, touchpoints, and other relevant segments
- C-Suite have a bird’s eye view of performance on employee, location, etc.
Want to learn more about the Report Hub and the recent roll-out? Check out the current release notes.
