


Introduction
Welcome to the final eBook of our Monetized NPS series. So far, we’ve discussed best practices and benchmarks for companies looking to measure and act on customer feedback. As your program matures and you’re able to track trends, it’s vital your business clearly proves ROI to generate growth within your NPS program.
If you’re here, that means you’re looking to join the ranks of companies like Hewlett
Packard Enterprise Software and Cisco in correlating your NPS program to revenue
or, more specifically, retention rates, referral values and up- and cross sales.
In this eBook, we’ll discuss the third and fourth stage of our series: monetizing NPS to grow your bottom line. We’ve combined these stages into one eBook as they both address a central part of your Net Promoter® program: achieving growth with your existing customers.
Research has shown companies can reduce churn twice as fast by monetizing their
NPS program. Companies do this by adding and correlating revenue to their NPS programs and measuring and improving retention, referrals, up-sales and cross-sales. Within each chapter, we’ll look at each of these substages.

Table of
Contents
- Part I: Monetize
- Adding and Correlating Revenue Figures
- Linking CX Metrics to Revenue
- Measuring Retention
- Measuring Customer Referral Value
- Measuring the Impact of Online Reviews
- Part II: Grow
- Improving Retention Rates
- Growing Referral Business
- Maximizing Customer Loyalty and NPS® with Referral Marketing
- Growing Up-sells and Cross-sells
- Conclusion
- About Us
Part I:
Monetize
Part I: Monetize
Monetized Net Promoter ties revenue value to and correlates revenue with NPS. Adding revenue figures to the process of measuring and acting on feedback provides insights into a company’s strengths, weaknesses, opportunities and threats through the eyes of the customers. To tie revenue to your NPS program, and determine whether a loyal customer will recommend your business, the monetization process goes through the following steps:

Adding and Correlating Revenue Figures
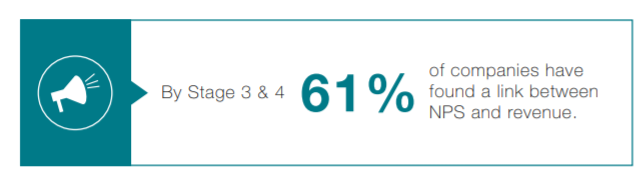
According to our most recent benchmark survey, by stage 3&4 (Monetize and Grow), 61% of companies have found a link between NPS and revenue. Many companies only look at NPS and total revenue, but the task is to establish the link between NPS and customer loyalty growth factors like retention rates, referral sales rates and up-/cross sales rates.
Combining and correlating your NPS data with revenue figures, such as subscription
fees, sales revenues, profits and customer lifetime values is easier said than done
for most companies.
First, you need access to and updated information on financial data, which can be challenging. This can be due to outdated information or a lack of access to this information. Not every CX person is allowed to see what may be confidential information. Second, adding and correlating that data with your Net Promoter program is difficult without the right tools.
The ultimate purpose of adding and correlating revenue figures is to enhance the
Measure and Act stage. Once you are able to link financial data with NPS, you can
begin doing so.
Adding and Correlating Revenue Figures
Measure
Surveying with significance
You should always aim to survey with statistical significance in mind. However, if you need to survey less, those surveyed should also contain a good share of your company’s revenue because their feedback and subsequent follow up have a greater impact on your bottom line.
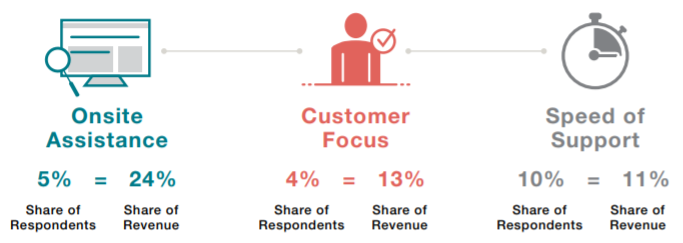
Drivers of revenue
Understanding the financial impact of drivers, and the share of respondents that selected them, can help prioritize what to improve. For instance, if few, but the most valuable detractors, require onsite assistance, whereas the many, but less valuable detractors, require self-service features, then onsite assistance weighs heavier.
Adding and Correlating Revenue Figures
Act
Closing the loop for all respondents/accounts can be difficult for some companies. The solution is to prioritize customers according to financial value, e.g. by filtering out customers below a chosen threshold. Similarly, closing the loop at the management and executive levels should use revenue-based driver analysis to prioritize actions.
These are just a few of the reasons why combining a customer experience metric
like NPS to financial information is vital. But where do you start? Here’s a few tips:
1. Make sure your financial and CRM data is clean
CRMs and financial data can get notoriously cluttered if not kept up-to-date.
Ensure you have the most up-to-date customer information.
2. Know the value of your customers and correlate that to their NPS responses
This is really two tips, but we’ve combined them: Once you’ve gathered your Net Promoter Scores® and financial data, begin correlating them together to see if any insights can be found. Some companies use an NPS SWOT tool to identify opportunities, at-risk accounts, etc. This allows businesses to say, “This highvalue client is at-risk of detracting. Extra effort to resolve issues should be made to save this client.”
Adding and Correlating Revenue Figures
3. Measure retention so you know what’s gained and lost
You need to know your revenue retention rate (RRR) and customer retention rate (CRR). In our 2017 study, almost 32% of respondents didn’t know their retention rate. The problem: a small amount of customer churn can easily translate into big revenue churn. You can learn more about this in our Retention Management to Combat Churn eBook.
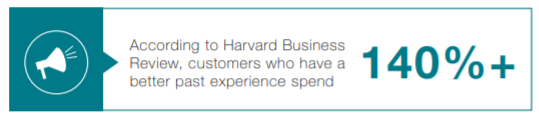
4. Identify which customers would be willing to refer you or have potential for up-sell and cross-sell opportunities
According to Harvard Business Review, customers who have a better past experience spend 140% more. What kind of opportunities are available among your own promoters? As previously stated, it can’t be assumed promoters will automatically refer you. You need to approach them and request this, just as you would any up-sell or cross-sell opportunity.
5. Begin setting goals and predictions based on trends
For example: “If we increase our percentage of promoters by 5%, profits will increase by 10%. We can tell this because promoters are 15x more likely to buy more than passives or detractors.”
Linking CX Metrics to Revenue
Hewlett Packard Enterprise
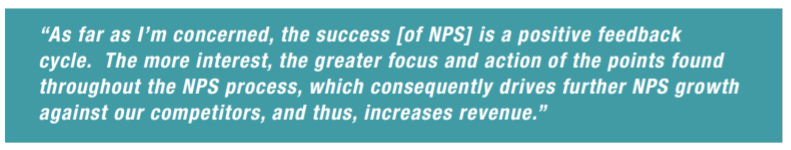
In an interview with Dr. James Borderick, head of the Net Promoter program and customer loyalty at Hewlett Packard Enterprise Software, he discussed how identifying areas to improve NPS have enabled HPE Software to qualify opportunities for revenue growth:
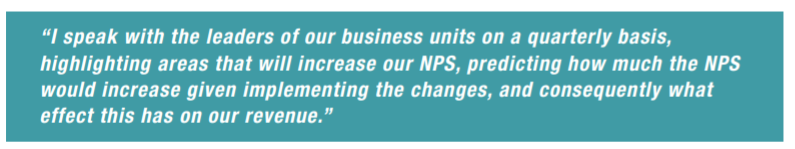
Part of ensuring NPS moves beyond just a vanity metric is recognizing that the score, in the long run, is less important than the insights it provides. Using NPS as a growth metric means it needs to be acted upon when feedback comes in. This, says James, is what gives NPS significance, and ultimately allows HPE Software to link NPS to revenue:

Measuring Retention
Despite retention being such an imperative metric to track in terms of customer loyalty, it’s shocking the amount of companies that still don’t know their retention rate.
While some non-contractual companies may find tracking retention difficult, in the lifecycle of a business the infrastructure for measuring retention should be in place. Not knowing how much revenue is lost to churn is a poor business practice, because it often means companies aren’t fulfilling the necessary steps to reduce that churn. When measuring your retention, you need to consider both your customer retention rate (CRR) and revenue retention rate (RRR). Your customer retention rate looks at how many customers leave you at the end of a period of time.

Here, CS is the number of customers at the “start” of the time period and CE is the number of customers left at the “end” of a time period.The customer retention rate helps determine how many customers churned.

Your revenue retention rate is the amount of revenue lost at the end of a period of time. Here, RS is the sum of revenues at the start of the period and RE is the sum of revenues at the start of the period for customers left at the end of the period. The revenue retention rate helps identify the value of your customers and the revenue impact if they churn.
Measuring Customer Referral Value
Our study revealed that only 44% of responding companies have a referral marketing program and track referrals, which is a basic requirement to calculating an ROI of referral marketing as well as Net Promoter.
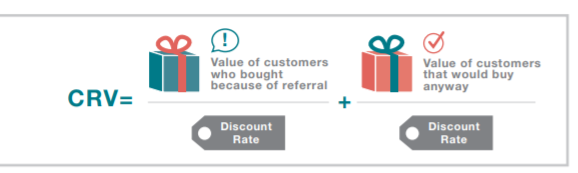
However, only 27% of respondents link their referral marketing efforts to their customer satisfaction or Net Promoter program. For those that establish a link or would like to establish a link between referral marketing and CX metrics, understanding how to measure Customer Referral Value (CRV) is critical.
CRV was first introduced in the Harvard Business Review article “How Valuable Is Word of Mouth”, and was defined as:
To find out which customers join due to referrals and how that shortened the sales process overall, you can start by asking joining customers in a simple onboarding survey.
For B2B companies, this is typically done with a win/loss review to understand why opportunities were won or lost. B2C companies can use online product registration surveys with purchase drivers in them.
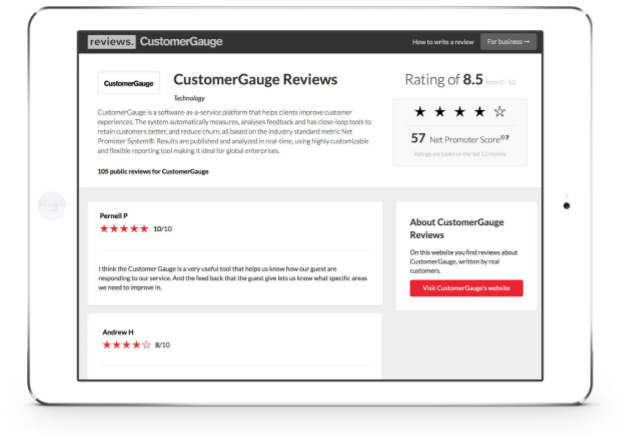
Measuring the Impact of Online Reviews
Measuring the impact that reviews have on your bottom line is also imperative to understanding the ROI of your NPS program. According to Northwestern University, using your customer experience/NPS program to display reviews online can increase conversions by 270%.
Try to begin analyzing the impact reviews have on your bottom line. Market research firm, Dimensional Research, in a study of over 1,000 responses, found that 90% of consumers say positive online reviews influence their purchasing decisions. In Dimensional Research’s findings, they found that two of the most important factors leading to a good customer experience were the speed at which a solution was found (69%) and the pleasantness of the person who helped them (65%).
Why does understanding this matter?

As part of your closed loop process, you can begin asking customers if reviews can be used on your online review site. Research from PowerReviews says that
80% of reviews originate from follow-up emails urging customers to review their past purchases.
Measuring the Impact of Online Reviews
Not only do reviews generate higher conversions, they also have an impact on how people find your company online due to SEO.
Remember though: Some customers may not want their reviews published, so make it clear and always give customers the option to refuse, or you risk impacting your response rates.
Part II: Grow
Part II: Grow
Now that you know how to measure and track revenue to NPS, retention and referral value, you can begin looking at methods to improve these areas. A mature Net Promoter program should start looking at linking referral marketing to NPS, implementing strategies to improve retention, and discuss how to grow up-sell and cross-sell opportunities with existing customers, who are 4-25X less expensive to sell to.
Improving retention starts by looking at the “why” behind customer churn. What drivers are leading to churn? What points of detraction are feasible to improve? From there, companies can begin creating action plans to improve drivers to decrease detraction and bank on opportunities for promotion.
Companies are often surprised to learn that promoters may not be the only customers willing to refer. Correlating this referral data and NPS data may find additional opportunities in passives as well. However, the real revenue driver is incentivizing promoters to refer you.
Amazon CEO Jeff Bezos revealed in 2006 that 35% of sales came from cross sales based on features like wish lists and “Customers also purchased…” products. As relationships with customers grow, so do their needs. Since it’s so much less expensive to sell to existing customers, businesses should grow areas for up-sell and cross-sell opportunities. Begin by looking at behaviors of similar customers who invested in services and build cases for other promoters who might have the same needs.
Improving Retention Rates
To begin improving retention, you need to understand WHY customers churn. This starts by looking at the drivers of detraction and churn surveys. When conducting relationship surveys, begin looking at those selected drivers of customers who gave scores of 0-8. In a Net Promoter System®, driver analysis can help easily identify what drivers are impacting scores. As shown in the example on this page, driver analysis looks at the overall NPS contribution over time.
You can learn more about how to conduct driver analysis in our NPS Handbook to Root Cause Analysis. By matching churn data with the detraction and passive drivers, companies can easily learn why these customers churn. If relationship survey data is old, transactional data may better explain churn factors.
Another way to improve retention is by conducting churn surveys. Churn surveys are similar to relationship surveys, and are used once a customer has decided to end a relationship with your company. It can include similar drivers to a relationship survey as well as a comment box in case a customer wants to elaborate.

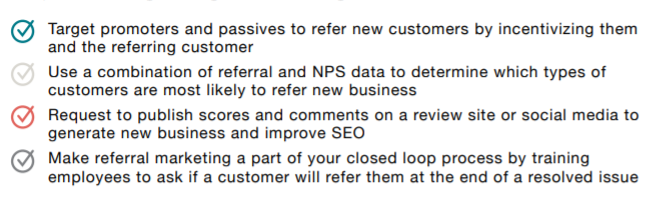
Growing Referral Business
As previously mentioned, companies can’t assume that customers will automatically review or refer their business. According to Northwestern University, 80% of reviews originate from follow-up emails by companies asking customers to refer or review their product/services. By combining referral marketing with your Net Promoter program, companies can begin to target new areas of growth:
As previously mentioned, companies that display reviews for products or services typically see an average sales increase of 270%. Based on the same Northwestern University study, “purchase likelihood increases 15% when consumers are exposed to reviews written by a verified buyer vs. an anonymous review.”
Maximizing Customer Loyalty and
NPS® with Referral Marketing
H&R Block
In 2016, tax advisors, H&R Block Canada, began tying their referral marketing efforts to their NPS program. In the 2016 fiscal year, their referral program focused on customers who gave them an NPS score of 7 or higher to refer new clients. After working out the kinks in 2016, in 2017 they began improving and streamlining their referral marketing program.
They invited all customers, regardless of the NPS score given (even clients who didn’t yet complete their surveys), and included requirements such as signing up to receive emails in order to participate in the program (no microsite or coupons).
In total, H&R Block Canada sent out over 500,000 Refer a Friend emails between February and May of 2017, with an open rate of 49%. The program grew by 13% from the previous year in number of participants, which led to larger financial gains in the end of 2017.
You can learn more about how H&R Block Canada monetized their NPS program
and the results of their referral marketing in the full case study.

Growing Up-sells and Cross-sells
Besides generating new business through referrals, additional growth can be found by pushing up-sells and cross-sells by utilizing NPS data.
As previously mentioned, it’s 4-25x less expensive to sell to existing customers, meaning that the sales process and spend is significantly less, with higher return. But how do you determine which customers to sell to? That’s where NPS data comes in. Using NPS SWOT analysis companies can do more than just identify high-value at-risk customers, they can identify opportunities for growth.
Selling to high-value promoters is usually straightforward (though some may argue not always easy). Customers like the brand, so targeted campaigns to key account managers (in B2B) usually do the trick. Selling to low-value promoters (and passives) is the missed opportunity. The challenge is to offer relevant products and services.
Begin by segmenting promoters to identify those with similar characteristics, such as industry, size and need. Use case studies with similar customers to entice those customers towards similar offerings (i.e., building the case).
Growing Up-sells and Cross-sells

Conclusion
More and more companies are experiencing continued growth through their Net Promoter programs. While there are still a large portion of companies (44%) struggling to track their retention, it’s promising that more are looking to tie referral marketing and other growth metrics to their Net Promoter program.
Companies like HPE Software and H&R Block Canada are already tying NPS to revenue and understand how NPS predicts likelihood to refer. We’d love to hear how your company is experiencing growth with your own Net Promoter program. If you have a story worth telling, reach out to us.
And if you’re looking for more resources, check out our comprehensive library.
