


About This Whitepaper
When your professional life is centered on Net Promoter® and you have seen numerous examples of companies growing faster due to successful Net Promoter programs, you wonder why some companies cannot achieve success with the concept or at least claim they cannot. To satisfy our own curiosity, we conducted a case study in 2016 with the aim to understand what a successful Net Promoter program looks like. There are several best practices “out there”—some of them are ours—but do they really work?
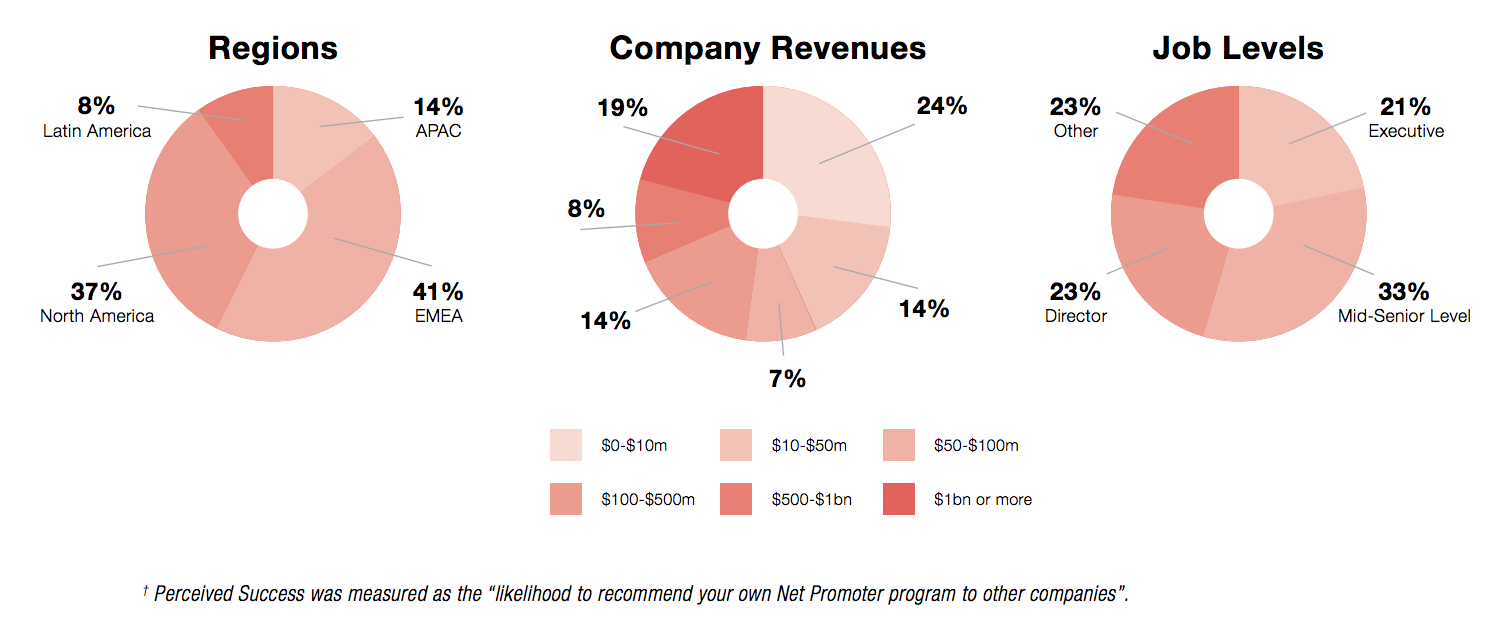
When conducting our 2016 study, we invited people from Net Promoter communities by email and received 640 responses from companies—of which 630 respondents from 620 different companies did some kind of Net Promoter program. Responses were well distributed on geography, company revenue, job level and industry (fig. 1) and included many well-known international brands. We measured success in terms of both perceived success† and actual financial gains.
Since we already addressed the perception of success in another report, in this whitepaper, we’ll mainly focus on the financial gains of Net Promoter. For instance, do current recommended best practices help companies achieve revenue growth? Are there other NPS tools or processes that ensure financial success? In this whitepaper, we outline our findings, which include best practices from our new Net Promoter model: Next-Generation Net Promoter.
"NPS is a worthless instrument, which only serves the vanity of the board members. Comment from our 2016 NPS Benchmark study “
The Current State of Net Promoter
The History of Net Promoter
Frederick F. Reichheld introduced the Net Promoter Score for the first time in his article “The One Number You Need to Grow” in Harvard Business Review’s December 2003 issue. Reichheld, already an authority on customer loyalty, found in his research that out of 19 loyalty attributes the best predictor of future growth was the customer’s willingness to recommend the company. To capture this willingness he asked a single question: “How likely is it that you would recommend [company X] to a friend or colleague?”
This question later became known as ”The Ultimate Question” in his 2006 bestseller by the same name.
The answer to the question was a number on a scale from 0 to 10, where 0 meant “not at all likely”, 5 meant neutral and 10 meant “extremely likely”. Customers with ratings of 9 and 10 had the highest rates of repurchase and referral and were called Promoters. The Passives—satisfied, but not as loyal—gave ratings of 7 and 8, and customers with ratings from 0 to 6 were labeled Detractors. The Net Promoter Score—defined as the percentage of promoters minus the percentage of detractors—correlated directly with revenue growth rates in most industries examined.
Reichheld’s three convincing arguments for companies to focus on their Net Promoter Score was: 1) it simplifies customer surveys, 2) which provide timely data that are easy to act on and 3) the score links to future revenue growth.
In 2008, Richard Owen and Laura L. Brooks, PhD, from the company Satmetrix introduced the Net Promoter Operating Model in their book “Answering the Ultimate Question”. The model was a practical guide to implementing a Net Promoter program, and while it added complexity to the Net Promoter concept, it also gave it a lot more structure. A few of the important points made were:
- Companies should treat a Net Promoter program as a cultural change management exercise. Product- and sales-centric organizations will often resist the Voice of Customer and the changes it impose. A prerequisite for success is both senior management commitment and buy-in from frontline employees.
- Companies should map their customer journey. Many get confused about when to use relationship and transactional surveys. The first provides the “real” NPS that links to revenue growth and should be measured on a continuous basis. Transactional surveys are used to follow up important customer interactions in the customer journey and provide additional detail about these touchpoints. Outlining the customer journey is required to understand which touchpoints affect the overall experience the most, the so-called moments of truth.
• Companies should close the loop. Reichheld mentioned that Net Promoter data was actionable, but gave little information about how to act. Owen and Brooks describe three levels of closing the loop ranging from operational follow-up to strategic decisions on investment needs.
"Net Promoter is simple, provides timely, actionable data and links to future revenue growth.''
Successful Net Promoter Programs
One success parameter is satisfaction, which we measured as a Net Promoter Score: How likely were companies to recommend their own Net Promoter program? Companies focusing on customer retention and referrals were most satisfied, followed by “customer research programs” and customer experience programs (fig. 3).
Satisfaction is of course subjective—and satisfaction with your own Net Promoter program is probably somewhat biased. The other success parameters measured in the case study were therefore growth related (and objective):
• NPS correlation with revenue
Reichheld’s claim was that NPS correlated with future revenue, typically 6-18 months later.
• Higher retention
Loyal customers stay longer.
We also asked questions about referrals and referral value, but data was unfortunately defective.

How Does NPS Correlate with Future Revenue?
Net Promoter became popular because it is simple, provides timely, actionable data and links to future revenue growth. We were surprised that only 33% of companies had been able to establish a link between NPS and future revenue. Companies may, of course, choose to believe instinctively in the existence of the link, but we always recommend establishing it. After all, the way to continued executive support happens through financial results.
We believe there are several possible reasons for this low number:
- Lack of focus: Companies not focusing on future revenue are less likely to establish the link (fig. 4).
- Program age: It is difficult to establish the link within one year. Remember, NPS correlates with revenue in 6-18 months (fig. 5).
- Tried, but failed: Some elements of future revenue may be independent of NPS and correlating total revenue with NPS may fail. For instance, many SaaS businesses get most of their revenue as subscription fees that depend on previous “purchases”. Since enterprise customers are likely to pay more than small businesses, but don’t necessarily give higher Net Promoter Scores, the total revenue per account is unlikely to correlate with NPS per account. Still, up- and cross sales may correlate better.
If the right focus and maturity is in place, more companies can correlate NPS with future revenue. For example, almost 60% of programs that focus on retention/referrals and are older than 3 years have established the correlation between NPS and future revenue.

Retention Rates
Retention and churn makes most sense in contractual relationships: When a contract terminates, the customer churns by definition. In non-contractual relationships, it is more difficult to define retention and churn. How often must a customer repurchase to not churn? Can a lack of repurchases be compensated by referrals? Despite this difficulty, we have seen several companies having defined retention in non-contractual relationships.
In our study, 40% of respondents didn’t know their retention rate (fig. 6). Among executives it was “only” 25%. Retention rates were widely distributed for most industries (fig. 7), with one exception: Retail trade only had companies with retention rates below 90%, also after NPS improvements.


How Much Does NPS Improve Retention?
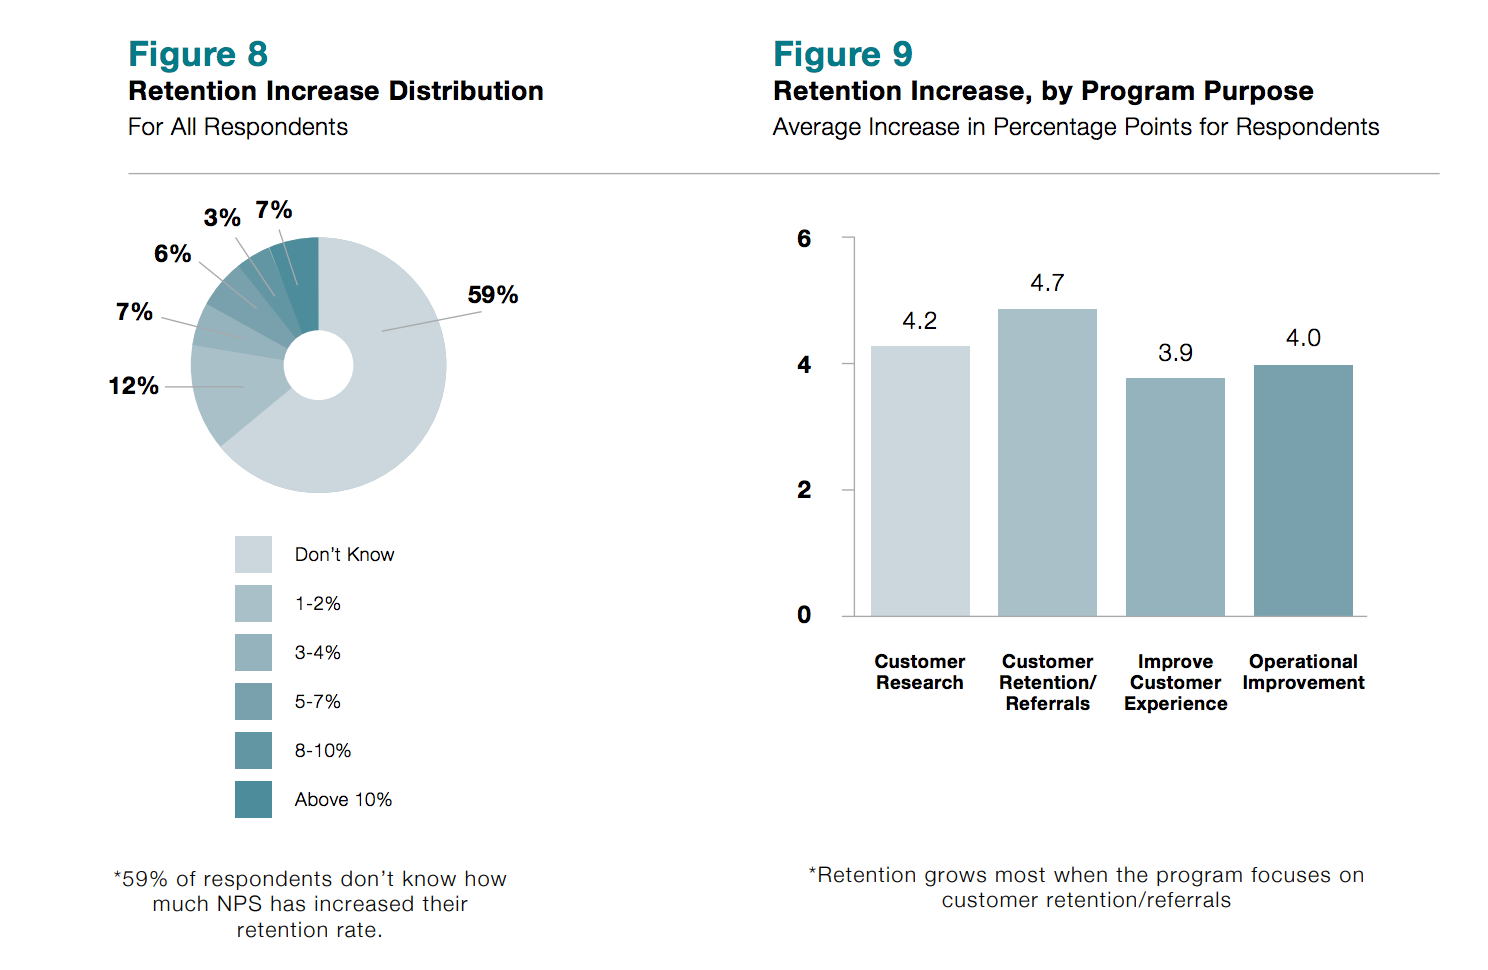
40% of respondents (25% of executives) didn’t know their company’s retention rate. An additional 19% of respondents (15% of executives) didn’t know how much NPS had improved retention (fig. 8). Since one of the purposes of closing the loop is to save detractors from defecting, there is definitely room for improvement in many Net Promoter programs.
The average increase in retention across all surveyed companies was 4.2 percentage points, which only about 40% of companies achieve within 2-3 years. We expected that a program’s age would explain a large part of the retention increase. However, more than 80% of the increase is due to other factors than age. One such factor is the program purpose, as programs focusing on retention and referrals are more successful (fig. 9).
Is a 4.2 pp increase of retention good? If your retention rate before the increase was 80%, then revenue grows by 5.3% (excluding the usual additional referral business and up-sells). Still, 4.2 pp is the average and by following some best practices discussed later in this white paper the retention increase can become much higher.
In the rest of this paper we use “Retention Increase” as our success parameter to define best practices.
Reasons for a New Net Promoter Model
Our study supports one of Reichheld’s conclusions in his HBR article that “a customer feedback program should be viewed not as market research but as an operating management tool”. Companies that take a “market research” approach by calculating the Net Promoter Score, analyzing its drivers, but then exclude a structured follow-up process, grow at a slower pace than companies closing the loop.
Our study also found that it is possible to improve the “traditional” Net Promoter model. By measuring and introducing processes around retention, referrals and up- and cross sells, companies can grow even faster.
In the rest of the whitepaper we introduce a new model for how to optimize growth in a Net Promoter program. The model comes with two prerequisites and four maturity stages: 1) Measure, 2) Act, 3) Monetize and 4) Grow. The prerequisites and the first two stages correspond to the Net Promoter Operating Model in the book “Answering the Ultimate Question”, though we did add additional suggestions to grow faster. The last two stages borrow concepts from the Customer Success industry. Other concepts are completely new.
Each stage contains 2-4 steps, 11 in total. The model implies taking stages and steps one-by-one, so a company does not pass Stage 1: Measure until it masters the two steps, Listen and Analyze, on this stage.
This restriction means that some respondents (39%) do not pass the first stage since they don’t analyze drivers. They may do some closed-loop activities, but their Net Promoter program is limited and they don’t follow best practices.
Less than 10% of responding companies were on stage 3 and 4.

The Next-Generation Net Promoter Model
Prerequisites
Any program requires planning, including a Net Promoter program. While we will not address the planning here, we do encourage companies to appoint a program manager with good project and change management skills. Two other important prerequisites for a successful Net Promoter program are:
1. Organizational support
2. Customer journey mapping
Both are also addressed in the previously mentioned Net Promoter Operating Model.
Adapting strategy and business processes to deliver better customer experiences is often a cross-organizational and cultural challenge in many companies and requires organizational support on all levels: both executive management buy-in and employee buy-in.
Many customer experience initiatives start by mapping the customer journey. Which customer interactions does a company have? What are moments of truth, i.e. customer interactions with a high impact on the overall customer experience? Knowing these is key to understanding what to survey.
Establish Organizational Support
How customer-centric and open-minded to Net Promoter is your company already? How much will Net Promoter change job tasks, responsibilities and accepted processes? Smaller or young companies usually accept changes better than large or more mature companies. Still, it’s a program manager’s responsibility to manage potential resistance.
Executive support is key to a successful Net Promoter program so in our case study we asked how important different levels of organizational support were to companies. Surprisingly, 60% said organizational support had no significant impact on the success or failure of the program. Yet, the increase in retention clearly correlates with the organizational support for the remaining 40% (fig. 11).
Companies with a lack of support at all organizational levels really struggle to increase retention whereas companies with full support at all levels thrive. It is easy to forget organizational support until it’s needed, but establishing and maintaining it improves program agility.
Executive Support
Executive support is crucial to a program’s start as executives are decision makers. Their support is won by showing an excellent program ROI. Executives are also key to keeping organizational focus, (e.g. by continuously communicating results and setting targets).
Management Support
Managers are essential to a program’s success as they prioritize resources and manage operations. Since the Net Promoter program creates a new risk of under-performing with the introduction of the Net Promoter Score, managers may question the concept. Note that their failure is the program’s failure, so be proactive: Be the first to identify poor performance and help managers to achieve and become successful.
Employee Support
Identify the “leaders” among employees, train them to become experts and make them ambassadors of Net Promoter. Their role will be to continuously support the program by handling questions from colleagues and mitigating any resistance.

Map Your Customer Journey
There are two types of surveys in a Net Promoter program: Relationship surveys and Transactional surveys, sometimes called Top-Down and Bottom-Up surveys. The first captures a customer’s overall experience with a company measured by the Net Promoter Score. This experience is formed by all interactions (or points) a customer has with the company in the customer journey.
Transactional surveys measure the customer’s satisfaction with individual interactions right after they occurred. The purpose is to understand how each (key) interaction creates detractors, passives and promoters. Often companies use other metrics than NPS such as CSAT and CES to measure transactions. In our study 32% of respondents said they used CSAT in addition to NPS whereas no one used CES.
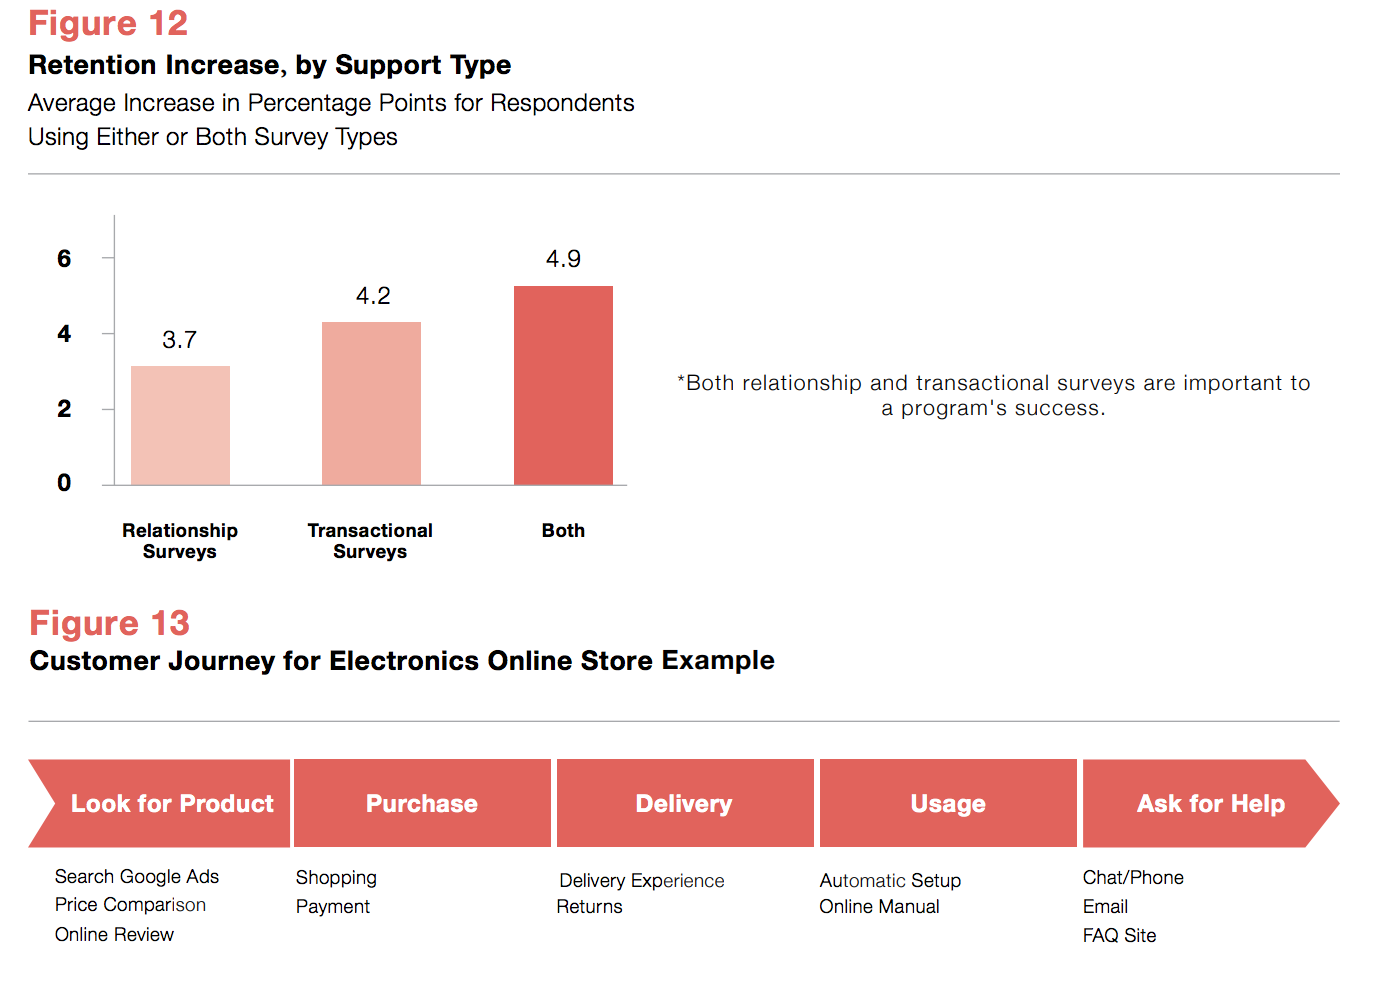
Companies using both relationship and transactional surveys improve retention more than companies only using one survey type (fig. 12). While the relationship survey ensures a focus on the overall customer experience, transactional surveys lead to faster insights and action. The challenge for some companies is to determine which customer interactions to survey.
Start by mapping the customer journey. List all known customer interactions and group them into the major touch points (fig. 13). Add the touch-points as drivers to the relationship survey and run it. Detractors and passives will mark which touch points to improve, promoters which touch points delight. Simple analytics can show how each touch point contributes to the Net Promoter Score as well as the areas to improve.
Stage 1: Measure
The first activity in a Net Promoter program is to measure the Net Promoter Score.
To calculate this, companies ask their customers the ultimate question usually through a survey.
Conducting surveys—or listening to customers—involves a number of variables such as who to ask, when to ask, survey frequency, survey design and response requirements. As described in the following section, Net Promoter surveys differ from other market research on some parameters.
Analyzing responses is required to understand the root causes of Net Promoter Scores and how to improve them. It is mostly seen as a market research discipline— by mistake—which is why many companies either avoid doing it or only do it to some extent.

Listen
We previously described how successful Net Promoter programs include both relationship and transactional surveys. Where the latter are triggered by transactional events, relationship surveys are typically conducted with a fixed frequency.
From a financial perspective, the most successful Net Promoter programs use short and frequent relationship surveys (fig. 14 and 15). Gauging relationships often allows companies to capture issues quickly, but also pushes them to “rescue” detractors in time.
As shown in fig. 15, the most efficient surveys ask 1-5 questions in addition to The Ultimate Question. These questions are typically used to understand the drivers of the score: Which experiences create detraction or promotion? Creating short and simple surveys that customers can answer in 2 minutes while still providing sufficient information about customer journey experiences is straightforward.
Nearly 30% of respondents only ask The Ultimate Question despite the general acceptance that the Net Promoter Score itself doesn’t drive actionable insights. With an average retention increase of 4.3 pp, this group did better than companies asking more than 7 questions. This moderate success was, however, caused by another best practice—Acting—that we will discuss in the next chapter. Of the 30% respondents, half of them followed up within one week allowing them to understand root causes of detraction and promotion. These 15% performed on par with surveys with 2-6 questions, whereas the other half performed as badly as surveys with many questions.

Listen (cont.)
Contrary to popular belief, our study showed that short surveys do not yield higher response rates. Average response rates were close to the average 33% irrespective of the number of questions. This is supported by other research that found survey fatigue gives lower response quality rather than lower response rates. Higher frequency does reduce response rates slightly but this is fully compensated by getting more answers within a short period of time (fig. 16).

The most popular—and usually most cost effective—survey media is email invitations with links to digital surveys, selected by 71% of companies (fig. 17). Phone interviews done by humans (22%) or IVR (5%) come in second and look more efficient. Not only do phone interviews have a higher average response rate of 42% (compared to 30% for email invitations) but they also seem to create higher retention (5.4 pp compared to 4.1 pp). This higher retention increase stems mainly from the survey frequency as phone interviews (and SMS) are used with higher frequency than email invitations. Whether phone (= mobile?) is easier to use more frequently than emails is a candidate for another study.
We picked the title of this section, Listen, deliberately. A Net Promoter program is not meant to do market research with long tiresome and typically infrequent surveys. Instead the aim is to continuously listen, capture issues fast and resolve them. Active listening is a communication technique used in counselling, conflict resolution and sales to increase trust and build relationships. If done well, Net Promoter is a digital version of active listening in
existing customer relationships.
For more information on how to define and send surveys in a Net Promoter program, check out The Fine Art of Surveying.
Analize
Using a simple survey technique and simple arithmetic companies can understand the key drivers of their Net Promoter Score. By just asking one or two additional questions besides the ultimate question it is possible to know how much each driver contributes to a company’s overall Net Promoter Score (fig. 18) and which parts of the customer experience detractors and/or passives want improved.
Many companies mistake Net Promoter for market research and think that driver analysis requires advanced inferential statistics and not least statistically significant data sets. Of course, this is an option and in cases where customer experience issues require larger investments quite sensible. However, front-line employees don’t need analytics to act on input from individual respondents or accounts and most managers can do with less than “statistical significance”. NPS does occasionally reveal unknown insights but for the most part it simply quantifies issues that are known to the organization. If, for instance, 45% of detractors say that product quality is an issue, it rarely comes as a surprise to management.
Companies that do driver analysis improve their retention more than companies that don’t do it (fig.19). Most companies (54%) register only a few drivers, typically because they ask customers to rate the satisfaction with and importance of every driver. Knowing that surveys have to be short, they limit the number of drivers.
Some companies use a free-text comment box in a survey as an alternative to asking customers about selected drivers. Reading comments to identify drivers can however, be a huge task unless the Net Promoter solution comes with text analytics. Only 17% of companies in the study, mostly large, used text analytics. There was no correlation between the use of text analytics and retention.
To learn how to analyze drivers in a Net Promoter program, check out Root Cause Analysis. “

Stage 1: Measure Takeaways
The Measure stage is vital for capturing Voice of Customer (VoC) and analyzing brand sentiment. After listening and analyzing customer data, companies can then begin to act on it.
Here’s a round-up of key takeaways from this stage:
- The most successful Net Promoter programs use short and frequent relationship surveys. This allows companies to quickly act on issues and rescue detractors.
- A Net Promoter program is not meant for market research. Instead, the aim is to continuously listen, capture issues fast and resolve them quickly.
- Companies that do driver analysis improve their retention more than companies that don’t do it.
- By just asking one or two additional questions besides the ultimate question, companies can determine how much each driver contributes to the overall Net Promoter Score and which parts of the customer experience detractors and/or passives want improved.
- Only 17% of companies in our 2016 study, mostly large companies, used text analytics.
Stage 2: Act
Acting on the collected input—also known as closing the loop—is essential to improving the Net Promoter Score. With structured processes companies can address both operational and strategic issues as well as close the loop by communicating their actions and progress back to customers. With frequent surveys, it becomes even more important to show customers what’s in it for them.
Ensuring continued organizational focus and optimizing program results also requires companies to set and track targets. Determining realistic targets requires the ability to calculate the likely impact of prioritized actions.

Close the Loop
Owen and Brooks defined three levels of closing the loop in their book “Answering the Ultimate Question”:
Front Line Level
Closing the Loop for Respondents
Front-line call back respondents for one of the following reasons: a) Ask for root cause to the score if this is unclear, b) Fix open issues with detractors and passives, c) Understand what it takes to turn a passive into a promoter, and d) Understand reasons for promotion and encourage referrals.
Closing the Loop for Accounts
In addition to or as an alternative to closing the loop for respondents business-to-business companies may also close the loop with accounts. Reviewing scores, drivers and comments in a client meeting allows the account manager to prioritize and agree actions with the client, add them to the account plan and follow-up in later meetings.
Management Level
Management carries two tasks:
- Understand the NPS drivers for their business function including what to improve to grow NPS.
- Identify best performance and share best practices within or across units. If some units or people perform better than others, identify reasons and train the other units or people to deliver the same performance. Identifying reasons often includes other metrics like first-time resolutions, employee churn, experience level and employee buy-in.

Executive Level
The executive level deals with structural issues that frontline employees or management cannot solve due to organizational limitations, investment needs or strategic implications. Frontline or management usually identifies issues and the executive level processes them (supported by the Net Promoter program management). Processing includes creating “business cases” and overseeing frequent meetings. The executive level is also responsible for communicating decisions about structural issues and activity progress to customers and employees.
Close the Loop (cont.)
Figure 22 and 23 illustrate the importance of closing the loop at the front-line:
- The more detractors Front-Line close the loop for, the more they save from churning.
- The faster the Front-Line close the loop, the more retention grows.
The usual perception supported by data from our own customers is that companies must close the loop in 48 hours. However, our study showed, that closing the loop in less than 2 weeks was as efficient as closing the loop in 48 hours with regards to retention.
For more information on how to close the loop in a Net Promoter program, download our eBookClosing the Loop."

Figures 24 and 25 show that closing the loop at the Executive level pays off:
- Addressing customers individually and/or telling them what the company learned, and which actions have been taken will retain more customers.
- Sharing scores, results and actions internally will help the company grow faster too.

Optimize
Measuring performance and setting targets is key to creating business growth, also in a Net Promoter program. 21% of companies do not set targets on how much their NPS should grow. These same companies only grew retention by 2.6%. Companies that set targets grew by 4.5 or more (fig. 26). The higher the target, the higher the retention increase except for ΔNPS-targets above 20 points. We rarely see such high targets, as they are mostly unrealistic.
Targets should be S.M.A.R.T., i.e. Specific, Measurable, Assignable, Realistic and Time-Related. Examples in a Net Promoter program could be, for example:
• The South-America Region should improve NPS by 10 points by year-end.
• The company should survey the top 75% clients and achieve a 60% response rate.
• Front-line should close the loop within 2 days for all detractors and within 7 days for all passives.
Companies can define targets by using what-if scenarios, e.g. “how much will our Net Promoter Score grow if we solve this issue?” It is difficult to make accurate predictions, but simple scenarios like “people that marked this issue will give us one score higher if solved” are often used to create realistic targets (fig. 27).
Some companies also ask detractors and passives in the closed-loop process how potential solutions to issues will affect their next score. Accumulating these possible changes can provide realistic targets.

Stage 2: Act Takeaways
Automated Net Promoter Systems enable companies to close the loop quickly with their customers. The only way to improve a company’s Net Promoter Score is by performing the steps within the Act stage, i.e., closing the loop and optimizing to improve.
Here’s a round-up of key takeaways from this stage:
- The frontline should be closing the loop with both customers, if B2C, and accounts, if B2B. During this time, they should be looking for the a) Ask for root cause to the score if this is unclear, b) Fix open issues with detractors and passives, c) Understand what it takes to turn a passive into a promoter, and d) Understand reasons for promotion and encourage referrals.
- Closing the loop at the management level involves understanding their business drivers and what to improve to grow their NPS, and identifying best practices within or across units.
- The executive level closes the loop with structural issues that frontline employees or management cannot solve due to organizational limitations, investment needs or strategic implications.
- Measuring performance and setting targets is key to creating business growth and creating a profitable NPS program.
- Companies should always set targets that are S.M.A.R.T., i.e. Specific, Measurable, Assignable, Realistic and Time-Related. Targets should never be unachievable.
Stage 3: Monetize
The best practices mentioned in the previous two chapters make the Net Promoter System simple but not necessarily optimal. When companies make raising their Net Promoter Score a goal in and of itself and focus mostly on improving customer experiences, some forget that the purpose of the program should be to create longterm growth.
The first step in monetizing NPS is to enhance the stage 1 and 2 by adding revenue figures. A detractor comes with a value and actions and priorities should
depend on this. Driver analysis also looks different when weighed by revenues.
Adding revenue also gives strategic insights about a company’s strengths, weaknesses, opportunities and threats through the eyes of the customers.
Additional steps towards ensuring that loyal customers stay longer, buy more and refer others are:
• Measure retention rate
• Measure and analyze referrals including the referral value.
• Correlate revenue with NPS

Enhance NPS with Revenues
Combining NPS with revenue figures, such as subscription fees, sales revenues, profits and customer lifetime values is not straight forward in many companies. Getting access to financial data can be one challenge, adding it to your Net Promoter solution another. However, when financial data is available it adds an extra dimension to Net Promoter data.
Measure
Listen
We recommend surveying as many customers as possible. If a company choose to survey less, with statistical significance or resource costs in mind, make sure to survey a good share of revenue.
Analyze
Driver analysis changes when based on revenue rather than the number of customers. For instance, if few, but the most valuable detractors, require onsite assistance, whereas the many, but less valuable detractors, require self-service features, then onsite assistance weighs heavier.

Act
Close the Loop
Many companies struggle to close the loop for respondents, and for accounts in B2B companies, often with inconsistent workflows as a result. The solution is to prioritize customers according to financial value, e.g. by filtering out customers below a chosen threshold. Similarly, closing the loop at the management and executive levels should use revenue-based driver analysis to prioritize actions.

Strategic Insights with the NPS SWOT
The NPS SWOT (fig. 30) is a simple scatter chart of accounts, products, or any other customer segmentation. Each segment has a Net Promoter Score, a financial value (e.g. revenue, profit or CLV) and fall into one of four quadrants: Strengths, Weaknesses, Opportunities or Threats. Each quadrant comes with its own drivers and their interpretation depends on the financial value in question.
We explain how to interpret the NPS SWOT with an example where:
• Segments = Products
• Financial Value = Revenue
Strengths
These are the most valuable products that customers love. Sell them into new markets, help customers to refer them to friends or colleagues and utilize the customers to build, test and market new products. It is crucial to understand the promotion drivers to copy success to other existing products or when building new products.
Weaknesses
Products that generate little value and customers dislike don’t belong in a product catalogue. The road to growth goes through higher Net Promoter Scores, which bears a cost. Consider selling the product lines to other companies. Alternatively, close them down.
Opportunities
Popular products that don’t generate much value may be new products or just on your shelf to complete a product portfolio. Utilize the learning from the Strengths quadrant to grow sales. Also incentivized customers to refer the products or utilize the promotion in other ways. Growth and profitability are key to any initiatives.
Threats
If detraction drivers are not product-related quickly fix them. Otherwise, launch initiatives to move customers from these products to other products. For example, Nokia phones after the introduction of the smartphone—they still generate considerable revenue but popularity is gone and soon revenue will be too.

Measure Retention
Calculating retention/churn is, in principle, straightforward, yet many companies fail to do so. Companies with only non-contractual relationships may find it difficult to define when a customer churns, but the two most common reasons we hear in conversations with companies are: 1) Companies lack the infrastructure to calculate churn or 2) Retention is not considered an issue. The first is a valid reason, but only in the short-term. Long-term, not knowing how much revenue a company loses due to churn can only be characterized as a poor business practice. The second reason may hold for monopolies or if customers have very high switching costs, but otherwise not.
To reduce churn companies must understand where and why churn happens. Understanding when customers churn in their lifetime (fig. 31), which customers churn (fig. 32) and why they churn (fig. 33) are basic requirements. Revenue, segmentation and churn data answers the first two requirements. Net Promoter data can answer the last.
By matching churn data with the detraction and passive drivers, companies can easily learn why these customers churn. If relationship survey data is old, transactional data may explain churn better. However, it is also possible to run churn surveys and force customers to answer them as part of a contract termination. Churn surveys resemble relationship surveys but may add additional drivers, e.g. “Better offer from competitor”. Also, a relationship survey and transactional surveys may not explain why a promoter churns (which happens), so churn surveys solve this issue too.
For more information on how to measure retention in a Net Promoter program, download the eBook: NPS 101: Retention Management to Combat Churn “

Measure Referral Value
Once a Net Promoter program begins to increase the number of promoters, it’s assumed that referrals will skyrocket. After all, promoters are extremely likely to recommend the company brand. In reality, few promoters do†.
Mobilizing promoters to refer a brand is called referral marketing. We will illustrate how referral marketing can utilize Net Promoter in the next chapter. According to research from Demand Metric and RewardStream* 60% of companies do referral marketing in some way, though only 5% of these companies have system support. Our study revealed that only 39% of responding companies track referrals, which is a basic requirement to calculating an ROI in referral marketing as well as Net Promoter (fig. 34).
In their Harvard Business Review article “How Valuable Is Word of Mouth”, Kumar, Petersen and Leone defined the customer referral value (CRV):

Understanding which customers join due to referral and to which degree referrals shorten the sales process is a requirement to calculate CRV. A straightforward way to obtain this information is to ask joining customers. In B2B, the concept of asking won (or lost) customers for root causes to their decision is called win/loss reviews. For B2C companies, you can ask for purchase drivers, for example, as part of an online product registration. A high-end Net Promoter solution will allow customers to run these type of surveys. Win/loss reviews not only
help companies calculate CRV, but also improve their retention by learning how to attract customers that stay longer.

Correlate Revenue with NPS
The purpose of Net Promoter is to create profitable growth and, at some point, the C suite will ask for proof. Correlating financial value with NPS can answer this request. Figure 36 illustrates a strong correlation, where up-sales revenue grows by 3.2% when NPS grows by 10 points.
Total revenue can be a sum of different revenue types, for example, recurring revenue like subscription and maintenance fees and one-time revenue like license and consultancy fees. Not all elements may correlate well with NPS. For instance, subscription fees rarely decrease when NPS drops, but tend to stay at the full amount until the customer churns. On the other hand, we often see up- and cross sales correlating well with NPS.
Having access to revenue data and its different elements, as well as proper analytical tools, is key to tying financial gains to Net Promoter programs.
For B2C companies the volume of customers and possible outliers makes correlation analysis difficult. In this case, it makes sense to aggregate the financial value for detractors, passives and promoters to know their average value and hopefully show that promoters are more valuable than passives, and passives more valuable than detractors. This can also give good insight into how much NPS increases may affect revenue.
Again, it is valuable to investigate individual revenue elements to fully understand which “correlate” with NPS. Often B2C companies have a large group of less valuable customers that skew an analysis. For which reason, it makes sense to start the analysis with the most valuable customers. Figure 37 shows the 10% most valuable and the 90% least valuable customers and their split into detractors, passives and promoters. The average customer value gives a good indication of how revenue can grow when NPS increases.

Stage 3: Monetize Takeaways
Raising your Net Promoter Score should not be a goal in and of itself. The purpose of any Net Promoter System should be to create long-term, sustainable growth. That is where the Monetize stage comes into play.
Here’s a round-up of key takeaways from this stage:
- The Monetize stage must begin by enhancing the Measure and Act stage by adding revenue figures. This offers insight into a company’s strengths, weaknesses, opportunities and threats.
- Companies need to measure their rate of retention to understand the extent of their churn. By looking at revenue, segmentation, churn and Net Promoter data companies can understand when customers will churn, which customers will churn and why customers churn.
- Since you cannot assume that your promoters will simply refer your brand, it’s important to implement referral marketing into your Net Promoter System.
- You need to calculate your customer referral value. Understanding which customers join due to referral and to which degree referrals shorten the sales process is a requirement to calculate CRV.
- For your NPS program to be successful, you need to tie your revenue to your NPS program. Having access to revenue data and its different elements, as well as proper analytical tools, is key to tying financial gains to Net Promoter programs.
Stage 4: Grow
Once NPS has been monetized and retention, referrals and up-/cross sales are being properly measured, it is time to grow in a controlled manner.
Growing retention includes predicting the likelihood of churn and then segmenting customers according to value and churn probability. For each segment, companies should then define which activities to carry out.
Referral marketing, in combination with Net Promoter, is a powerful tool to grow referral business. The concept allows companies to know which customers are likely to refer their business and then incentivize them to do so.
The final step in stage 4 is to grow repurchases, up- and cross sales. Here the challenge is to understand why some customers buy more than others, which customers are candidates for additional sales and are prone to marketing initiatives.

Improve Retention
Knowing when and why customers churn can be used to calculate the likelihood of churn for all customers. Net Promoter data rarely contains information about competitive challenges, macroeconomics and other factors that can play a role in churn. Companies can use churn surveys to capture this type of data rather quickly. For instance, if a competitor runs a campaign specifically targeted towards a company’s customers, churn surveys will quickly reveal this, as well as quantify the “financial damage”.
Based on the predicted likelihood of churn, we recommend companies split their customers into three groups: 1) At-risk, 2) Safe and 3) Grey Zone (fig. 38).

Grow Referral Business
To grow referrals companies should utilize referral marketing. This discipline is widely used by many businesses, in B2B as well as in B2C. A study conducted by Demand Metric and RewardStream in 2015 revealed that while 60% of companies utilize referral marketing in some form, only 5% have a system to support it.
Net Promoter adds a lot of value to referral marketing and an advanced Net Promoter solution can handle some referral marketing as well:
- Run marketing campaigns targeted towards promoters. Ask the customer to refer by offering incentives to both the customer and referred customers (fig. 39).
- Publish scores and customer comments on social media and online review sites and improve search engine results. Simply ask customers for a review in the Net Promoter survey and publish it online (fig. 40). Ask promoters to refer.
- Train employees to ask for referrals as part of closing the loop. An inquiry is often sufficient.

Grow Repurchase, Up- and Cross Sales
Getting customers to buy again or more requires that a company has additional products on the shelf. We mention this platitude since we sometimes meet companies that focus too much on acquiring new customers and not enough on growing existing customers. In fact, companies can earn much more revenue from sales with existing customers. For instance, Amazon CEO Jeff Bezos revealed in 2006 that 35% of sales came from cross sales based on features like wish lists and “Customers who bought this item also bought …”.
Selling to high-value promoters is usually straightforward (though some may argue not always easy). Customers like the brand so targeted campaigns and/or key account managers (in B2B) usually do the trick. Selling to low-value promoters (and passives) is the missed opportunity. The challenge is to offer relevant products and services.
Increase Sales of Existing Products and Services
For specific products/services, identify segments of promoters with similar characteristics (e.g. industry, size, location and needs) and sales opportunities. Understand why some promoters have bought the products/services in question, utilize them for case studies, online reviews and referrals and target campaigns towards other promoters (and passives) that haven’t bought these products/services (fig. 41).
Build New Products/Services
High-value promoters have been successful—in some way—with previous purchases and may want to be first to purchase new products/services. Companies can shorten the time-to-market of new products and services significantly by inviting such customers into the product development:
• They provide free product ideas
• They can review product ideas and prototypes
• They may test beta-versions of products
• They will be the first to buy the products
• They may provide stories for the products

Stage 4: Grow Takeaways
When implementing a Net Promoter System, companies are looking to grow with their existing customer base. The Grow stage is the final stage in creating profitable growth with a Net Promoter System and involves ramping up efforts with promoters, digging deep into at-risk accounts and capitalizing on up-sells and cross-sells.
Here’s a round-up of key takeaways from this stage:
- Companies can use churn surveys to capture the when, why and how of customer churn and segment customers into at-risk, grey zone and safe accounts.
- Grow referral business by implementing referral marketing programs into existing Net Promoter campaigns.
- Get word of mouth value by publishing feedback on online review sites.
- Understand why some promoters have bought products/services, utilize them for case studies, online reviews and referrals and target campaigns towards other promoters (and passives) that haven’t bought these products/services.
- Companies can shorten the time-to-market of new products and services significantly by inviting customers into the product development process.
The Future State of Net Promoter
Most Companies Focus on the Metric, Not the System
As described in the prologue, Net Promoter’s popularity came from its three characteristics: It’s simple, it provides timely, actionable data and it links to future revenue growth. Still, many companies “forget” about the latter two characteristics:
- Less than 53% of respondents did some follow-up activities
- Only 33% linked NPS to revenue
- 21% did both follow-up activities and linked NPS to revenue
About the Author