


Leaky buckets and bottomless pits — these are just some of the terms that describe the impact of an unfavorable churn rate. You’ve put resources into acquiring accounts, only for them to slip through the proverbial cracks.
Our research shows that B2B companies lose 23% of customers annually, while B2C companies lose 32%.
Off they head into what Adam Dorrell, CustomerGauge Co-Founder and CEO, has defined as Churn Nation: a not-so-mythical place where “residents love to squander shareholder wealth.”
And when we say squander, we’re talking serious money. It’s thought that nearly $2 Trillion is lost every year to churn.
How much money would you lose if you made no steps toward combating churn? (You don’t have to guess this number. Head here to our ROI calculator, where we’ll help you come up with an exact figure.)
Inaction is costly. Understanding your customer churn rate and its implications for your bottom line is vital. But, as you’ll see, only so long as the data is acquired accurately and actioned effectively.
Let’s dive in.
Quick Answer: What Is Customer Churn Rate?
Churn rate is the percentage of customers who stop doing business with you during a given period. The formula: (churned customers / total customers at start of period) x 100. For B2B companies, average churn runs approximately 23% annually, but the number only matters when it is tied to revenue impact. |
What Is Customer Churn Rate?
Customer churn rate is a simple metric that shows the percentage of customers that leave your business within a given period. It’s a baseline retention metric that gives you insight into the rate of churn in your company.
If you don’t know your company's churn rate, you’re not alone. Our research showed us that approximately 44% of companies don’t. Considering the high cost of churn, this is worrying —but it’s not cause for panic.
You’ll be pleased to know that the calculation itself is devilishly straightforward. Its implications are more complex (and we’ll take you through these in a moment) but there are tools available to help you navigate them.
Customer Churn Rate Formula
The customer churn rate formula is simple:
(churned customers / total customers at the start of period) x 100
‘Churned customers’ refers to the number of customers that leave your company within a particular period.
‘The period’ refers to the time frame you’re gathering data for—monthly, quarterly, or annually, for example.
Let’s say you choose to review your churn rate for June 2022. At the start of this month, you have 400 customers. At the end of the month, you have 310. That means you lost 90 customers during the month.
Plug that into our formula, and you get:
(90/400) x 100 = 22.5%
What Is a Good Churn Rate?
Our research shows that the average churn rate for B2B is 23%. According to this 2016 study, it’s likely higher for B2C companies, coming in at around 31%. (It’s significantly lower for SaaS companies, sitting in the region of 8%.)
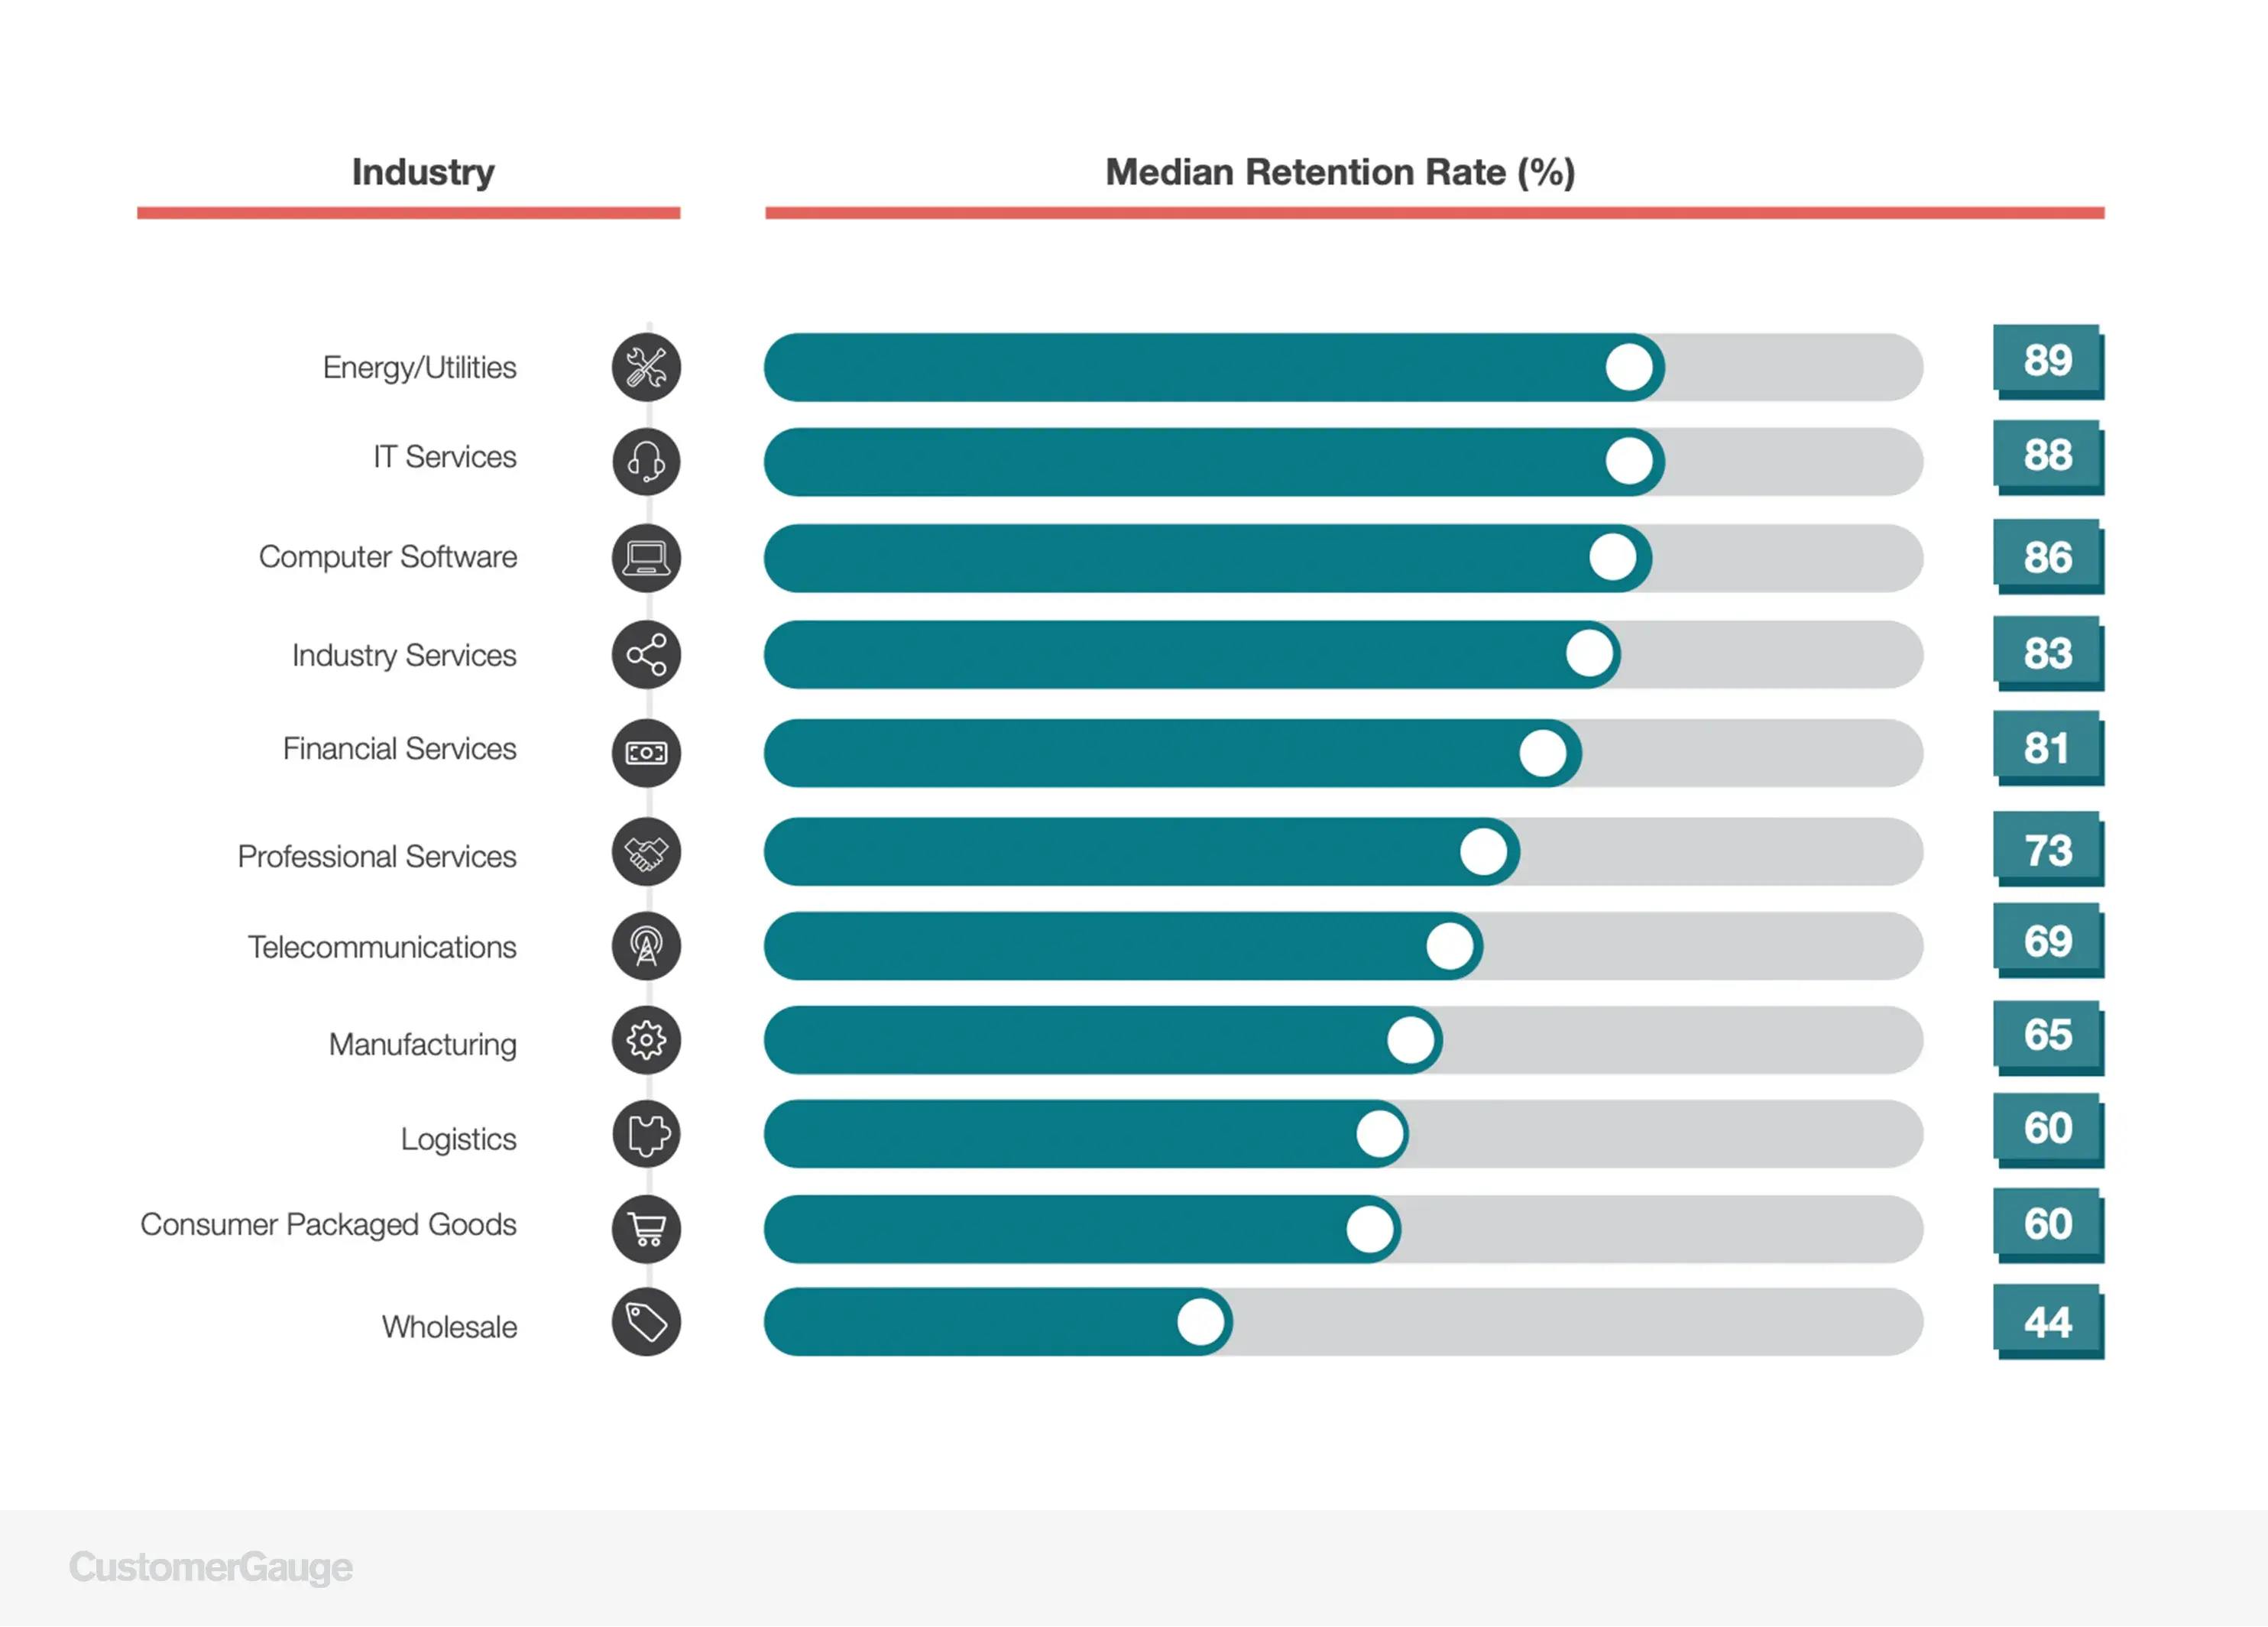
But it’s also industry-specific. Retention rates (the inverse of churn) look something like this:
Churn Rates: Handle With Care
The trouble with a metric this simple is that it has to be effectively interpreted and integrated into a larger framework if it’s going to mean anything. That requires first defining the parameters of the terms specifically and then tying them to the material reality of your company.
Here’s how to do that.
Define “Churned Customer”
We know that a churned customer is one that’s no longer bringing revenue into your business. But when exactly do they become a churned customer? Is it at the point when they cancel a subscription? Is it when the terms of the contract officially come to an end?
And what about if a customer signs up halfway through a period and churns within that same period, are they considered churned?
There’s no right or wrong here. But to understand the impact of churn on a particular period, these factors must be decided upon and consistent.
Choose your Period
Consider what makes the most sense for your business.
There are pros and cons to opting for different period lengths. While there’s an immediacy to the insight that monthly churn statistics give you, they may not reflect patterns that apply on a larger scale.
On the other hand, opting to choose an annual period may not give you the reflection you need to understand the immediate impact of a major corporate decision.
Seasonality may also impact the churn rate. For example, the churn rate in December may be much higher or lower than in July.
(And that can apply to annual churn too. We’ve all learned that comparing 2020 to any previous year is not necessarily the most accurate way of doing things.)
The metric itself is only a starting block — and one that must be well-built. And here consistency is key. Compare apples with apples, months with months, and years with years. Also, clearly define what you mean when you say churn.
And then, make sure those metrics are cogently tied to revenue.
How to Tie Customer Churn Rates to Revenue
You have to tie your churn metrics to your bottom line to justify the effort to gather the data. There’s no way around this. If you can quickly show the financial impact of churn, you have a case to combat it.
Here, another simple metric comes into play: revenue churn. Essentially, this is about understanding how much churn costs you over a period.
To use the revenue churn formula, you will need to know:
How much revenue you had coming in at the beginning of your chosen period
The number of customers churned in that period
The average revenue worth per customer
Substitute those numbers into this formula, where churned recurring revenue is the number of customers churned multiplied by the average revenue worth per customer:
(Churned recurring revenue / recurring revenue at the start of period) x 100
Let’s return to June 2022. Remember that in that month 90 customers churned out of an original 400? Given that, on average, each customer is worth $1000, that gives you a churned recurring revenue of $90,000.
And now let’s say that at the start of June, you had a recurring revenue of $750,000. In the churned revenue formula, that will look like this:
($90,000 / $750,000) x 100 = 12
That means your churned revenue rate is 12%.
That’s useful to know as a broad picture metric, but it doesn’t take into account a crucial element of customer churn:
See how CustomerGauge connects churn data to account revenue in real time.
How to Calculate Customer Lifetime Value From Churn Rate
If you find, for example, that two of your biggest accounts bring in 40% of revenue, you’re going to want to be particularly cautious about losing those accounts.
Some customers are not only likely to spend more, but also to make more referrals, be more loyal, and provide constructive feedback. Generally speaking, they’re also easier to serve.
A useful metric to couple with customer churn is Customer Lifetime Value (CLV). This is the net profit gained by a particular customer over the duration of their entire engagement with your company. It relies on predictive modeling and the equation is somewhat more complex.
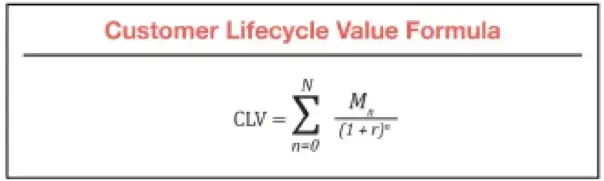
Where the elements are as follows:
N is the customer lifetime in years
Mn is the margin in year n, i.e. the revenue minus operating costs
1 / (1 + r)n is the discount factor (and r the discount rate)
An easier way? HBR has a handy calculator. But again, unless these results are fed back into a comprehensive experience program, you can end up being inundated with data that does not tie back positively to your bottom line.
Another key consideration here is customer acquisition costs. Spending a significant amount to acquire customers that churn within the month has some important applications for your business.
The bottom line? While the churn rate formula is simple, integrating it into a retention program may not be.
How CustomerGauge Can Help Improve Your Churn Rate
While customer churn rate is easily calculated with a simple formula, to make that data count, it has to be:
Tied to revenue.
Part of a global customer (CX) strategy.
That’s what our Account Experience platform provides.
Beyond this, we use this insight to model predictive churn. By collating churn data with other CX metrics, we look at the likelihood of particular customers churning. We then help you take steps, such as facilitating referral, retention, upselling, and cross-selling programs, to mitigate the risks of losing valuable accounts.
Ready to move from tracking churn to preventing it? See CustomerGauge live.
CustomerGauge is a B2B NPS and revenue retention platform. Beyond tracking churn as a metric, Account Experience connects customer feedback to account revenue in real time -- so teams can identify at-risk accounts, predict churn, and act before customers leave.
About the Author