Introduction
In our most recent white paper, we introduced the Monetized Net Promoter® model.In this eBook, we’ll discuss the first step in mastering this new model: measuring customer feedback.
After all, how will you ever master customer experience without talking and listening to your customers? Surveying and digging deep into customer feedback is necessary in any successful customer experience program.
Part of measuring customer feedback includes listening through surveys and analyzing the results. To better understand brand sentiment, companies use relationship and transactional surveys to capture the Voice of Customer (VoC). They then dig deep into the data and drivers to determine the root cause of issues to improve business processes and provide timely follow-up with customers.
We’ll discuss each of these stages in greater detail throughout the course of this
eBook.

Table of
Contents
- Part I: Listen
- Relationship vs. Transactional Survey
- How to Conduct a Survey: Frequency, Questions and Media
- Don’t “Game” the Net Promoter System®
- Part II: Analyze
- Digging into Drivers
- Debunking Text Analytics
- Determining Root Cause
- Conclusion
- About Us
Part I:Listen
Part I: Listen
Getting your customer experience program off the ground and running means implementing a strategic survey process. There are a few things to consider when kick starting your surveys:

It’s important to remember that the purpose of a Net Promoter (NPS) survey is to
determine customer loyalty and what variables affect it. There are two types of NPS/customer experience (CX) surveys: relationship and transactional. Where the latter are triggered by transaction, relationship surveys are typically conducted with a fixed frequency.
Beyond determining which of these to use, companies also need to determine the number of questions they will ask and the frequency at which they will send these surveys.
In this chapter, we’ll dive into the Listen substage and provide best practices for conducting your next great survey.
Relationship vs. Transactional Surveys
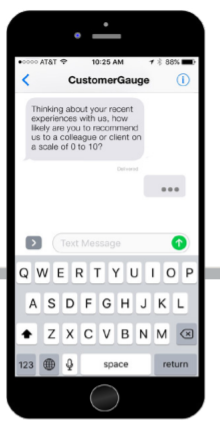
Relationship NPS surveys seek to investigate a customer’s loyalty to a company/brand, by asking customers to consider the overall experience and satisfaction they have with a company and give you an overall view of the brand sentiment. These surveys should occur at regular intervals (e.g., monthly or quarterly).
From a financial perspective, the most successful Net Promoter programs use short (two or three questions) and frequent (up to four times a year) relationship surveys.
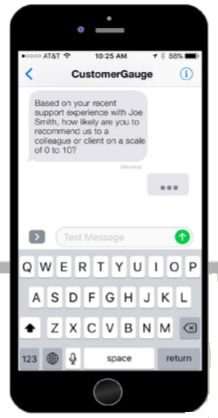
Transactional NPS surveys investigate the experience a customer has in a specific transaction/interaction (touch point). These surveys can give deeper insight into individual touch points. This survey is designed not to measure overall customer loyalty, but to measure satisfaction with a specific company touch point to improve it.
The purpose of these types of surveys is to understand how each (key) interaction creates detractors, passives and promoters.
Relationship vs. Transactional Surveys
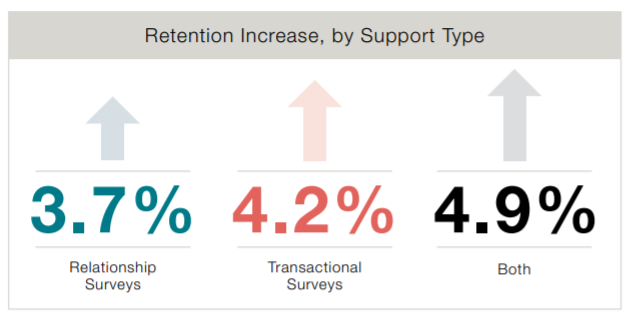
Based on CustomerGauge’s research, companies that conduct both relationship and transactional surveys receive the highest rise in retention, showing a growth at 4.9%. Start by conducting your relationship surveys to assess your current Net Promoter Score and brand sentiment. You can then begin to expand into transactional surveys. To supplement your surveys, you can also include driver diagnostic questions, which will allow you to more clearly pinpoint reasons for dissatisfaction among your customers with aspects of your business. Companies usually also add comment boxes to encourage additional information to inform their scores.
We’ll discuss how to analyze these parts of your survey in the next chapter when we
talk about driver analysis and text analysis.
How to Conduct a Survey:
Frequency, Questions and Media
There are three vital questions you should ask prior to conducting a survey:
1. How Often Should I Survey My Customers?
We recommend that you operate your survey throughout the business year (with occasional hiatuses for seasonal vacations). Making it part of your daily “operatingsystem” promotes best practices in an organization. Technology allows you toautomate the entire operation, and there is no need to do an “annual send” or “seasonal survey”.
Relationship surveys should be sent 2 or 4x times a year to help you understand longitudinal trends (that’s a fancy term for seeing a change over time).
Transactional surveys can be sent after each touch point interaction (soon after the
event).
In all cases, ensure that you don’t over survey your customers. Tell them what you are doing up front, and use a system that prevents sending too many messages in a given time.

How to Conduct a Survey:
Frequency, Questions and Media
2. How Many Questions Should I Ask?
In addition to the frequency of your surveys, you should also consider the number of questions you’ll want to ask. According to our research, the shorter your surveys, the higher your response rates. Typically, surveys between 2-6 questions have the highest retention rates—between 5.2-5.3%.
Typical NPS surveys include the ultimate questions, and some additional questions such as follow up driver questions about a particular experience. These types of surveys offer VoC and generally have a higher response rate.
Longer surveys, like those with 17-20 questions are often used for market research surveys. The shorter your surveys, the more frequently you can conduct them. So, you wouldn’t want to conduct a market research-like survey every month. If you’re looking for quick actionable feedback, stick to NPS VoC surveys with shorter survey
questions.
Customers also hate it if you ask questions that they think you know the answers. In other words, don’t say “how long have you been a customer?”.

How to Conduct a Survey:
Frequency, Questions and Media
3. How Do I Get My Survey to Cusomers?
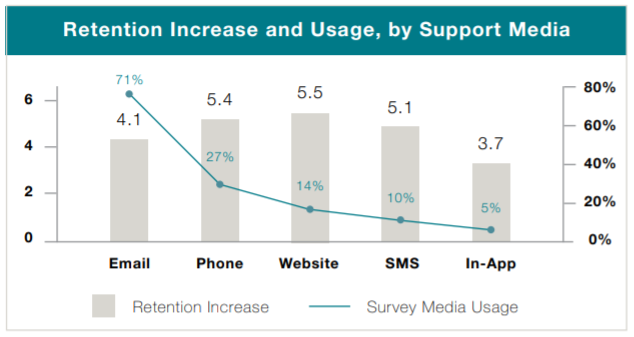
After you’ve chosen the number of questions, and decided on the frequency at which you’ll conduct your surveys, it’s time to choose your channel. Below is a chart shows the different media channels that can be used for surveys.
71% of companies primarily use email surveys to conduct their survey programs. While the retention increase (4.1%) is not as high as website or phone.
We offer a lot more tips on conducting surveys in our Fine Art of Surveying eBook.
Don’t “Game” the
Net Promoter System®
Gaming a Net Promoter System includes any practice with the purpose of achieving a higher score. Since NPS is more about improvement than just the score, this can be troubling.
As a consumer or employee, you may have experienced the “gaming” processes some companies play in order to boost their Net Promoter Score.
There are four techniques companies use to game their Net Promoter Score:
1. Introducing Bias by Signaling Outscomes
2. Bribery
3. Guilt
4. Picking Favorites
Don’t “Game” the Net Promoter System®
1. Introducing Bias by Signaling Outcomes
Some choose to inflate scores by using visual or color cues (i.e., a colored scale
or emoticons). The Net Promoter System only works if you get accurate answers, not guided responses. If a customer gives you a score of 9 but is a passive, you’re less likely to identify areas for improvement or link your Net Promoter Score to revenue growth.
These kinds of colored scales are good for teaching employees about NPS, but shouldn’t be used in customer surveys.
Have faith that your customers understand that 0 is a bad score and 10 is a good score. Typical NPS surveys are clear about how the scale works, as shown in the example survey from Apple which puts “unlikely” by 0 and “likely” by 10.
Alternatively, you can also ask a follow up question: “What would it take for you to give us a 10?”, to gain a better understanding of the data.

Don’t “Game” the Net Promoter System®
2. Bribery
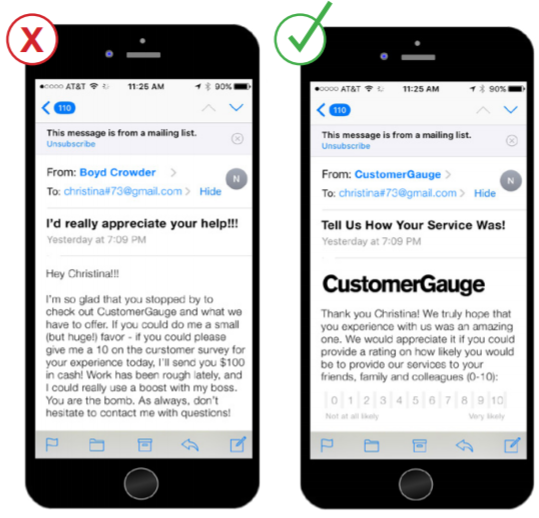
Offering customers incentives for giving a good score is an intentional form of gaming.
Ultimately, this type of gaming should be discouraged among employees. This can be difficult when bonuses and overall performance are tied closely to NPS scores.
There are ways to remedy this issue:
- Centralize/automate communication to customers about surveying
- Involve management and executives in closing the loop
- Ensure a direct delivery of surveys to customers (don’t have employees directly call for an answer)
- Educate employees about the benefits of accurate results
Don’t “Game” the Net Promoter System®
3. Guilt
Imagine: After visiting a dealership, you get a call from your representative. They tell you about a survey they are sending, and then go on to describe how theirjob depends on the score you give. Yikes.
Besides this being an awkward position to put your customers in, it also has a big impact on your NPS score. Imagine every employee at a dealership does this. Corporate then looks at those numbers and says: “Hey, look at how good the dealership in Burlington, MA is doing. Let’s find out what they’re doing right and use it to inform our other locations in the Greater Massachusetts area.”
It’s important to remember that NPS data has a domino effect on how companies adjust business processes.

Don’t “Game” the Net Promoter System®
4. Picking Favorites
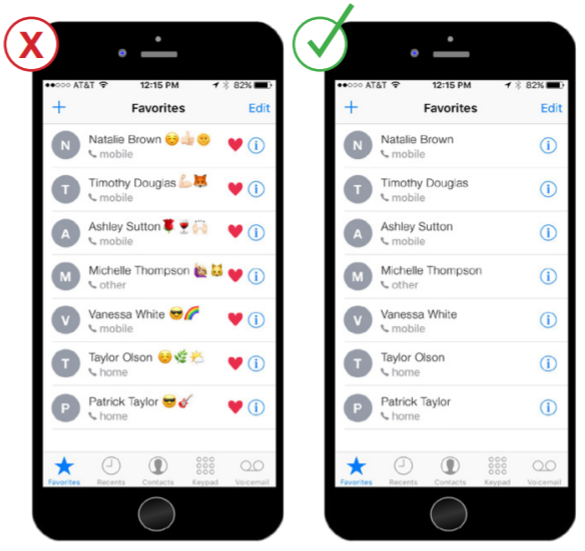
While everyone likes a bit of flattery, constructive criticism is necessary for well, being constructive. Whether it’s selecting customers who have been chosen by the sales or customer service team, or excluding customers likely to churn, “cherry-picking” survey participants only results in a partial view of the true customer experience.
This gaming tactic is typically intentional, but may happen unintentionally too. For instance, B2B companies often suffer from poor CRM data quality and might not have
sufficient customer contact information. People registered in a CRM database are typically your main contacts and the people you have the best relationships with.
To solve this, ensure that you have a robust survey system that does not involve any frontline staff in choosing who to send surveys to. Also, be careful about those systems on your automated telephone system (i.e., “please stay on the line to take our survey”). Agents can cut off the caller if they feel the experience might not have
been up to snuff.
Part II:
Analyze
Part II: Analyze
Now that you’ve chosen your survey media and gathered your feedback, it’s time to begin analyzing your data. There are three sets of important data you should analyze—your NPS score, drivers and comments.
Analyzing your data provides insights, such as:

To calculate your NPS scores you need to subtract the percentage of detractors from the percentage of promoters. So, if 50% of respondents were promoters and 10% were detractors, your Net Promoter Score would be 40.
If you’ve included drivers in your surveys, you’ll want to conduct a driver analysis to identify what factors are contributing to your overall NPS score. Root cause analysis based on drivers will allow you to get to the heart of your customer experience issues and churn.
You should be able to get a sense of the drivers of satisfaction or dissatisfaction by reading comments. In our experience, around half of the completed surveys contain “open text comments”. You can manually tag comments, look for key words and use other techniques to understand sentiment. Some automated systems use passive text analytics to identify key areas—this may help you if you have a large volume of text to analyze. However: be ready to spend time training a system to get reasonable results.
Digging Into Drivers
At CustomerGauge, we perform driver analysis to understand which areas of our customer experience to improve. By simply asking 1-2 more questions in addition to the NPS question, companies can determine how much drivers contribute to their overall NPS score and how to improve.
These type of cascading questions limit the amount of overall questions you need to ask in your survey, boosting response rates. They also enable companies to easily drill down on the root cause of their churn and NPS score to enhance customer experience and business processes.
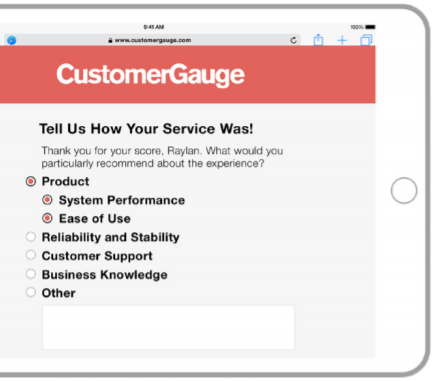
Companies that rigorously do driver analysis improve their retention. Based on our research, companies that do implement driver analysis increase their retention by 4.9% or more.
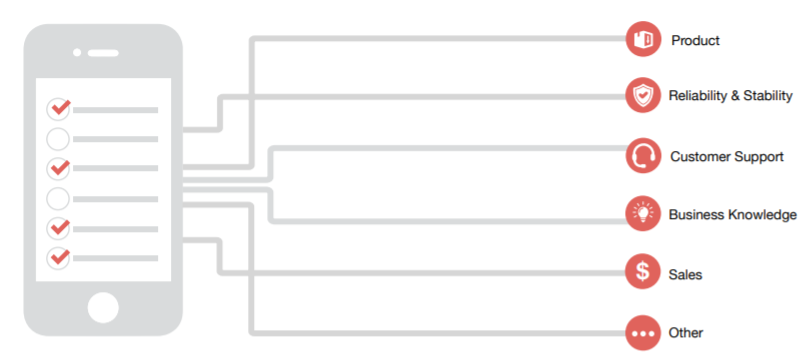
There are different ways to ask for the drivers behind a score, but we recommend that the respondent just selects them from a list with drivers and subdrivers, as shown in the example.
Digging Into Drivers
Selecting drivers from a list in a survey as opposed to using additional questions has a number of benefits:

As a best practice, we suggest using around 5-6 top level questions, each with 4-6 options (giving 25-36 possible options). In addition, make sure each top-level question is aligned to a department within your business. That way, you can make a single departmental manager responsible for their score.
Debunking Text Analytics
Text analytics describes a set of linguistic, statistical and machine learning techniques that organize and make sense of comments from surveys. Companies use text analytics to derive relevant meaning from written comments. But why should you use text analytics in addition to driver analysis?
Some companies use a free-text comment box in a survey as an alternative to asking customers about selected drivers. However, reading comments to identify drivers can be a huge task. In our research, only 17% of surveyed companies used text analytics. In addition, there was no direct correlation between text analytics and retention.
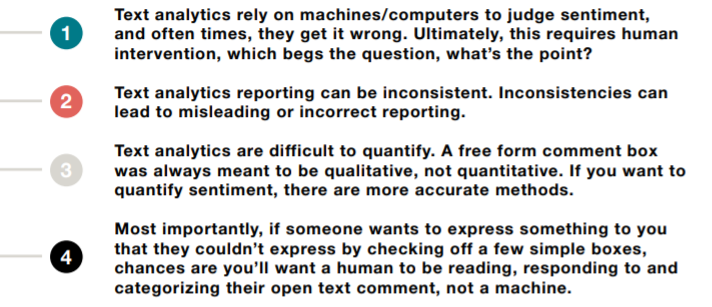
For this reason, CustomerGauge typically dissuades customers from using text analytics. Our go-to Customer Success Manager, Andrew Todtenkopf, offers a number of reasons for this:
Debunking Text Analytics
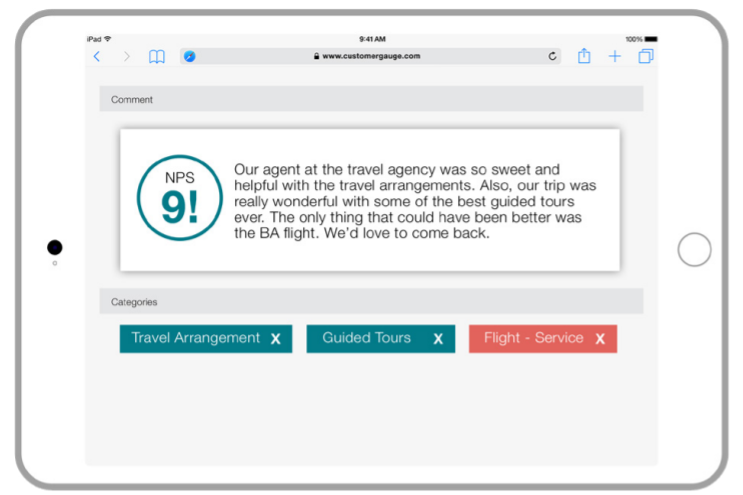
If you must use text analytics, we suggest using interactive text analytics. As customers are typing their comments, tags are automatically generated. This type of categorization should be done to determine, much like with drivers, which categories are contributing the most to your NPS score.
Determining Root Cause
When simple driver analysis isn’t enough to determine the cause of detraction, companies can rely on root cause analysis to fill in the narrative gaps.
They can do this by reaching out to a group of customers about why they marked certain drivers.
One of the best and most simple examples of root cause analysis is the use of the 5 Whys, developed by Sakichi Toyoda of the company Toyota. This involves using 5 open-ended questions to get to the heart of a problem.

Determining Root Cause
Companies can use root cause interviews to gain more information about scores and chosen drivers. Root cause interviews should only be used as part of the closed loop process for individuals or accounts.
It’s important to remember that doing root cause interviews can be quite a large undertaking. So, it’s important to make sure you have the resources and man power to do the task correctly.
Conclusion
When mastering the new Monetized NPS model, the first step is to utilize best practices when measuring your customer’s feedback. In order to effectively listen to your customers, you must choose how your company will do so.
You can choose either relationship or transactional surveys (or use both), and discuss how you’ll conduct the surveys, keeping in mind the ideal frequency, questions and media. It’s also vital that you discourage people in your organization from gaming the system. Remember, it’s not about the score, it’s what you do with it.
Once you’ve collected customer feedback through the Listen step, you must now move onto the Analyze phase to create actionable steps for improvement to your business processes.
