


Introduction
Annual Report
Welcome to CustomerGauge’s NPS® & CX Benchmarks Report, based on our annual industry survey highlighting the state of Net Promoter®. This year, we expanded our NPS insights and collaborated with MIT CISR to add academic rigor to the methodology.
I’m incredibly proud that CustomerGauge is at the leading edge of the Monetization movement in the Net Promoter industry. As a company, we have been evolving the CustomerGauge solution to help businesses show return on investment within their NPS programs to link Net Promoter improvements to increased growth.
This study shows that many businesses are on the same journey. We are working with some of the leading CX practitioners—a few are even spotlighted in this book. However, there is still much to learn for some organizations. In fact, a third of businesses still do not know their retention rate, and those that do can still improve to more than 90%—the standard of world class leaders. In this report, we sought to provide standard benchmarks and best practices for businesses to improve their own NPS and CX programs in the coming year.
Thanks again to all the participants, including our spotlighted companies, from this year’s survey and report. I hope you find the results informative for building out your customer experience efforts.
A Note From MIT CISR
Annual Report
Improving your customer experience is a key part of your business transformation.
At MIT Center for Information Systems Research (CISR), we specialize in digital business transformation. From interviews, we’ve identified two dimensions that companies are transforming on: customer experience and operational efficiency. Both are important for succeeding in the digital economy and remaining competitive. As we talked to companies about their transformations, we realized that companies were taking one of four pathways:
1. Companies following pathway 1 initially emphasize standardizing their core processes and building a digital platform with API-enabled business services. These companies automate and reduce inefficiencies, and work on reducing legacy systems and processes. This pathway takes time and is often less risky and disruptive than the other pathways. However, in order to meet customer demands, pathway 1 companies have to improve their customer experience.
2. Companies with a pressing strategic need to improve their customer experience across the entire enterprise often take pathway 2. They develop new offers—often bundling multiple products or services, building mobile apps and websites, and improving call centers—all with the goal of improving the customer experience. The biggest disadvantage to this pathway is that the new customer experience initiatives can create additional complexity, requiring employee heroics to deliver the product to the customer. The company then has to improve its platform to be able to deliver a seamless customer experience at a reasonable cost to serve.
3. Companies that have a less urgent need to improve their customer experience can follow pathway 3, a stair-steps, more incremental approach, by frst addressing the customer experience with a project like implementing omni-channel capabilities, then improving operations by removing some legacy systems or creating an API layer and then repeating. The changing focus of projects requires a well-defined road map if this approach is to succeed.
4. Companies that have determined that there is an uphill battle to transform the current organization can take pathway 4—create a new organization. This pathway allows a company to start fresh, with no legacy systems and processes (or silos), and to develop a culture, customer base, workforce, and customer experience from scratch. This is a risky endeavor but may be the best solution given the circumstances. The biggest challenge is how, and whether, to eventually integrate the new enterprise into the existing company.
As we were developing this research, we knew we needed to learn more about the customer experience. MIT CISR has traditionally studied platforms, but digital has created more opportunities for customer engagement and made the role of the customer experience critical to a company’s success. To gain a more holistic view, we reached out to CustomerGauge to collaborate on a 2017 NPS® & CX Benchmarks survey. Some of the results found echo other research we’ve done, although the sample differs. 60% of respondents who answered the question about the type of transformation reported they were following pathway 2 (versus 22% in other MIT CISR research).
The pressing strategic need to improve the customer experience is reflected in the much lower percentage of current online revenues and mobile revenues that companies on pathway 2 report compared to companies on pathway 1 (online revenues: 21% vs. 28%; mobile revenues: 13% vs. 21%). But as the results in this report suggest, addressing the pressing need to improve customer experiences (as measured by self-reported NPS) is correlated with increased revenue growth, retention growth and referral rates. There is more work to be done on examining the role of improving customer experience in a digital business transformation, but the research done here is a critical step in the right direction.
Executive Summary
Annual Report
The Net Promoter System® is one of the most widespread methods in business today to measure and improve customer loyalty. It asks the question “How likely are you to recommend [brand name] to [a friend/family/business associate/…]?” in combination with a few extra questions to provide companies with their Net Promoter Score® and the reasons behind that rating. The popularity of Net Promoter stems from its simplicity in providing actionable customer feedback and that the Net Promoter Score links with future growth.
Back in 2016, CustomerGauge conducted the first-of-its kind survey on companies running Net Promoter programs to learn about best practices and benchmarks, as well as determine the characteristics of NPS leaders and the common missteps of NPS laggards. The report defined NPS leaders by their ability to use NPS to establish higher retention rates and more revenue. Based on the findings from 2016, CustomerGauge established the Monetized Net Promoter model, which divides the Net Promoter best practices into NPS maturity levels. The Monetized Net Promoter model was first described using four levels of maturity: Measure, Act, Monetize and Grow. However, it was later limited to three levels to reduce conceptual complexity and to resonate better with c-suite executives.

About The NPS & CX Benchmarks Report
In 2017, CustomerGauge conducted a new survey in collaboration with MIT CISR and NPS Benchmarks that expands on the insights from 2016. This new NPS & CX Benchmarks Report compiles the latest fascinating revelations from those surveyed companies, which includes top Fortune 1000 leaders. Based on the research, CustomerGauge found that companies that have reached the highest maturity level, Grow, outperformed companies on other maturity levels on several parameters:
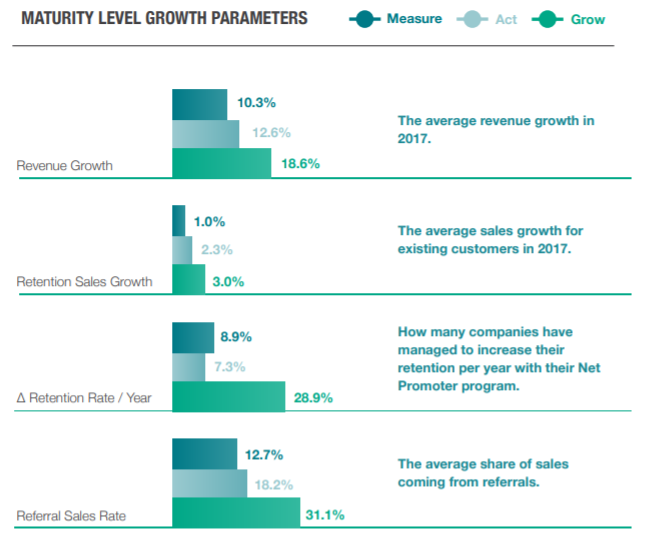
The results are remarkable, as they document how Net Promoter can be used to improve several customer loyalty behaviors that increase growth: retention, up- and cross-sales, and referral business. These behaviors lead, in turn, to higher revenue growth by several percentage points.
The report also looks at several Net Promoter best practices using the latest data on the previously mentioned loyalty behaviors as well as insights from industry titans including Microsoft, Salesforce, Vodafone, Colliers, Micro Focus and Affirm. In addition, this year the report includes additional industry insights for 15 different industries.

Within Each Industry Section We Explore The:
- Average Net Promoter Score and program age
- Average retention rate
- Average return on retention
- In depth customer experience insights based on external and internal research
Research Method
CustomerGauge invited several thousand companies to participate in the study about their digitalization and customer experience strategies. Part of the study concerned the use of Net Promoter and other customer satisfaction metrics, the processes used to analyze and act on customer feedback, and the abilities to relate satisfaction metrics to customer loyalty behaviors. Or, more specifically, the following three growth parameters mentioned earlier:
Retention Rate / Year
The mean yearly percentage point increase of a company’s retention rate during the lifetime of the Net Promoter program. By measuring this in the NPS program per year it is easier to compare programs irrespective of program age.
Retention Sales Growth
The increase in up- and cross sales to existing customers from 2016 to 2018. Gartner estimates that around 80% of future revenue comes from just 20% of existing customers. Increasing sales with existing customers can accordingly have a high impact on overall revenue growth.
Referral Sales Rate
The share of sales generated by referrals. Most companies generate new sales by referrals, but the point of this metric is to determine how Monetized NPS impacts the share of overall referral business and revenue growth.
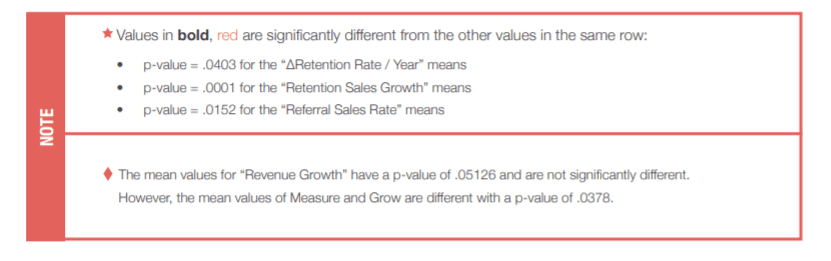
The sample size of respondents was 468, of which 415 reported on their Net Promoter Score. The report only uses these Net Promoter Scores to report average scores per industry in a separate section. Note that although NPS is a widely adopted standard, there are variances in implementation and measurement styles, and the research has not accounted for this. Neither does it infer what the objective of the NPS measurement was, or if the score is statistically significant. In the analyses, the data used Analysis of Variance (ANOVA) to determine if the mean values are different or not. The significance threshold was set at .05.
Demographics
Business Type & Location
This year 468 respondents participated in the report, with 15% of 2016 respondents returning to take the survey. Of these 468 responses, 58% of them were B2B and 42% were B2C, with locations across the world. In the 2016 survey, CustomerGauge had 49% B2B/51% B2C

Revenue & Job Roles
Company size and revenue varied greatly in the survey, offering a wide range of answers from large to mid-size businesses. Many of the responses came from those in senior management positions, which showed that programs were getting overview from key stakeholders.


Measure: Listening And Analyzing Feedback
Annual Report
Measuring customer feedback is the first step a company takes to improve their customer loyalty. To ensure a successful feedback program, companies use a number of KPIs to track perceived success. These includes response rates, retention rates and, of course, the Net Promoter Score.
To better understand brand sentiment, companies use relationship and transactional surveys to capture the Voice of the Customer (VoC). The research found that companies who used both survey types had at least a 4.9% increase in retention. Companies then dig deep into the data and drivers to determine the root cause of issues to improve business processes and provide timely follow-up with customers.
- Emails are the most popular media to use when conducting surveys.
- Half of Net Promoter practitioners use another CX metric like CSAT or CES in coordination with NPS.
- Response rate is a vital KPI for tracking customer engagement.
- Understanding your sampling fraction will lead to higher response rates.
- Surveys should be short and sweet.
Survey Media-Email is King
Emails are still, by far, the most popular survey channel for Net Promoter and customer satisfaction programs. Digital channels look like they’re becoming more popular and the drop-in phone survey usage is definitely remarkable.
The report looked at Net Promoter Scores and response rates to see if any channel provided better results, however the differences were insignificant. Though, it appears that phone-based surveys or meetings provide better response rates. Below, the results from the 2016 survey are compared to this one. One of the strongest areas of difference appears to be with the decreased use of phone surveys between 2016-2018.

Spotlight: Microsoft
Industry: Technology
Microsoft Corporation is an American multinational technology company with headquarters in Redmond, Washington. It develops, manufactures, licenses, supports and sells computer software, consumer electronics, personal computers, and services. Its best known software products are the Microsoft Windows line of operating systems, the Microsoft Office suite, and the Internet Explorer and Edgeweb browsers.
How Microsoft Office 365 Made Customer Satisfaction a Business Priority
Microsoft Office 365 is a cloud-based subscription service by Microsoft that brings together the best tools for the way people work today. By combining best-in-class apps like Excel and Outlook with powerful cloud services like OneDrive and Microsoft Teams, Microsoft Office 365 lets anyone create and share anywhere on any device. Since its inception, Microsoft Office 365 has demonstrated an excellent commitment to offering a productivity service that is customer-centric and meets the expectations for price and quality. But how does such a large tech company keep its focus on customer satisfaction?
Simple, it always listens to its customers. One of the key ways Microsoft Office 365 does that is through the Net Promoter System, which allows the company to pinpoint key touch points that will drive satisfaction.
We sat down with Microsoft Office 365’s Voice of the Customer (VoC) team to learn how NPS helps the company improve customer satisfaction, reduce churn, and increase customer growth for Microsoft Office 365.
Prior to using NPS, Microsoft Office 365 customer feedback was difficult to distribute to the right departments which caused communication barriers that stagnated action plans. With the implementation of the Net Promoter System, Microsoft Office 365 transitioned to real-time data. Insights are now coming in daily and at a high volume instead of a small amount of data at a quarterly cadence. As such, it’s been easier for Microsoft to get internal buy-in because teams are seeing greater data consistency as well as lots of feedback.
Here are three NPS best practices Microsoft Office 365 shared with us.
Share Results Internally & Establish Cross-Organizational and Leadership Support
With millions of customers sharing feedback, Microsoft Office 365 quickly realized that establishing cross-organizational and leadership support is the best way to make sure customers know their insights are carefully listened to and acted upon.
The company has a specialized NPS team that is in charge of measuring, analyzing and sharing customer feedback results with the relevant departments. Microsoft measures NPS for both Microsoft Office Commercial and Consumer markets and looks for the root causes of customer satisfaction. Once the data is collected, classified, and analyzed, it is reflected in a dashboard that is available for the right teams to access, discuss and act upon. Sharing customer feedback across the entire company helps all roles develop more customer empathy and reflect on how they can individually improve the customer experience. Teams and individuals can review responses by organization, region, or subscription type, as well as search the comments by keyword to drill down into specific product areas.
As such, Microsoft Office 365 has seen first-hand how establishing support across all organizational levels helps increase retention and has been key to its successful Net Promoter program.
Focus on Internal NPS Benchmarking
When it comes to evaluating NPS results, Microsoft Office 365’s team uses internal and industry benchmarking. As such, the company sets targets for metrics like NPS, response rate, close-loop KPIs, etc. within the organization. Questions likes “How did we do last month, last quarter or last year?” or “What are the NPS targets for deferent products within the Microsoft Office 365 suite?” help Microsoft obtain a reliable assessment of their NPS performance and drive continuous improvements.
Microsoft Office 365 also sets targets for deferent products and areas within Microsoft Office 365. Targets are also set related to how the company measures NPS, such as response rate results.
We want to hear from as many customers as possible, so we are always optimizing for response rates, even if that means a lower score. We do lots of A/B testing to see what works best. For example, we tested which email subject lines worked best for getting high quality responses.
Use NPS to Proactively Save Detractors and Increase Retention
Having a mature NPS program that uses both relationship and transactional NPS surveys pays dividends. CustomerGauge’s white paper revealed that companies using both types of NPS surveys can achieve up to a 4.9% average increase in retention. The frequency and survey media are also an important element to increased retention, with email, phone and website/in-app surveys being the top 3 most popular. Microsoft Office 365’s team surveys customers using website/in-app and email medias. In-app NPS surveys help the company capture fresh customer insights from its most engaged users. As such, Microsoft Office 365 uses in-app NPS surveys as a fast way to get a lot of data quickly, all based on the transactional experience of customers. Such feedback captures the level of satisfaction with the customer support experience or the completion of tasks within the application. As a result, the company is able to understand how key interactions like contacting customer support contribute to their percentage of detractors, passives and promoters. Using two different modalities to make sure the company reaches as many customers as possible is important to the Microsoft Office 365 NPS program.
On a relationship level, Microsoft Office 365 uses a mix of in-app and email NPS surveys to capture a customer’s overall experience measured by the Net Promoter Score. This experience is formed by all interactions a customer has with Microsoft Office 365 in the customer journey. NPS insights help the Microsoft Office 365 team better understand customer needs, from consumers to large enterprises, and to build a predictive framework for saving detractors. For example, through NPS surveys, the team has found that whenever an enterprise customer’s subscription is about to expire, that a customer’s business productivity is affected and that, in turn, can lead to customer churn. As a result, Microsoft Office 365 uses a proactive framework, where support agents contact customers if they are nearing their subscription expiration date, offering instructions and help to renew their subscription, and thus decrease the number of complaints.
NPS insights help us understand the best times when we should proactively reach out to customers, and this initiative has helped us get happier customers, increase retention, and achieve a better NPS score.
Customer Experience Metrics
In CustomerGauge’s 2016 study, they reached out mainly to Net Promoter practitioners. For the report, however, results expanded to all companies using other metrics as well, including CSAT (Customer Satisfaction Score) and CES (Customer Efort Score). Many companies are beginning to link metrics together for a more holistic view, such as HPE Software. In fact, 49% of NPS practitioners also use other CX metrics.
Both CSAT and CES are good for high volume transactional surveys like support calls. CES fits transactions that customers require to be effortless. CustomerGauge found that more than one-third of companies also use CSAT, and 1 in 6 use CES (Customer Efort Score). This is an increase compared to the 2016 survey, where 32% of respondents said they used CSAT in addition to NPS, and no one indicated using CES.

Response Rates—Statistical Significance And Indivicators of Engagement
Researchers tend to look at response rates for statistical reasons only. CustomerGauge often sees that Net Promoter programs that have reached “Stage 1: Measure” stop surveying customers once a statistically significant sample has been achieved. Response rates do, however, also reflect customer engagement. And engaged customers tend to be more positive towards a brand. As the data shows, companies with higher response rates (61%-80%) tend to have higher overall Net Promoter Scores (greater than 55). In 2016, the average response rate between respondents was 31%.
Response rates of 50% are possible —and they normally go hand in hand with high NPS scores. In other words: Engaged customers are more loyal!

Coverage Is What Really Matters
Coverage indicates how large a part of your customer base the collected feedback covers. If you only survey a small fraction of your customer base, it’s easier to get a high response rate. So, the report compared the coverage to two success factors: retention sales and referral sales. In the following chart, the circles represent retention sales, or the up- and cross-sales to existing customers, and the squares represent referral sales, or the share of sales generated by referrals. When coverage grows, so do the sales of existing customers and the share of sales generated by referrals. There are two reasons for this:
1) The higher the response rate is, the higher your coverage. Since higher response rates usually mean more engaged customers, high coverage rates usually mean more promoters. The more promoters you have, the more sales to existing customers and referrals you are likely to have too.
2) Another aspect of a high coverage rate is that you’ll identify more promoters. Knowing who your promoters are makes it easier to sell more to existing customers. Since promoters are more likely to buy from you, you can better target your sales efforts. Knowing who your promoters are also make it easier to incentivize them to refer your brand.

Surveys Should Be Short And Sweet
The purpose of surveying in a Net Promoter program is not just to collect and analyze data, but to act on the data you collect. Long surveys tend to move the focus from acting to analyzing data.
The chart shows how companies with short surveys focus on acting, thereby reducing churn. The chart also shows that one-question surveys are too short. Not understanding the drivers of your score also limits your options of acting on feedback.
2-6 questions are the “sweet spot” (+2.3% retention increase per year) for identifying areas to reduce churn and retain customers. In the previous 2016 survey, CustomerGauge also found that frequency can play a part as well. Companies that surveyed their customers at least every quarter received a 5.2% increase in retention.

Driver Analysis- The Short Cut To Root Cause
In the survey, 16% of companies reported that they don’t analyze the root cause behind scores in their customer satisfaction program. Companies will struggle to make strategic changes based on customer input if they do not perform a thorough root cause analysis.

It may seem difficult to do both a thorough analysis while keeping a survey short. However,
by using the special techniques described in CustomerGauge’s Root Cause Analysis4 eBook you will easily learn:
- How much each driver/touch point contributes, positively or negatively, to your Net Promoter Score
- Which areas of your business to improve based on weighted drivers
- How much your Net Promoter Score may grow under certain scenarios if you fix selected problems
Spotlight: Affirm
Industry: Financial Technologies
Affirm is a financial technology company committed to providing honest financial products to improve lives. Founded in 2012, Affirm is led by the visionary entrepreneur behind PayPal, Yelp and Slide—Max Levchin.
Affirm"s Commitment to Honest Finance is Driven by NPS Success
Affirm has gained a lot of attention over the last few years as a leader in the fintech space. Based in San Francisco, Affirm is a financial services company that offers installment loans to consumers at the point of sale on retailers’ websites and via their mobile app. Unlike a credit card, consumers take out individual loans per purchase instead of a revolving line of credit. So far, Affirm has already issued more than one million consumer loans, totalling an estimated $1 billion and recently raised an additional $200 million at a nearly $2 billion valuation, according to The Wall Street Journal.
Affirm’s founder and CEO Max Levchin says that his main point of pride is Affirm’s Net Promoter Score of +83. For Levchin, building a company that people actually want to recommend to their friends is crucial, especially in the financial landscape. It also creates a halo effect for the merchants that partner with Affirm to offer their customers a more transparent way to pay. That’s because Affirm places a much higher priority on trust, loyalty and customer experience than on profit:
At its core, NPS is a measure of trust, and so long as our customers continue to trust us with their time, money, and well-being, we know we’re doing something right. I receive notifications from our NPS survey results and work with our Ops Team to understand how and why we get certain results.
Here’s what Max Levchin and his team at Affirm shared with CustomerGauge about their NPS program and achievements:
The Need for Brand and NPS Transparency
Having helped steer Yahoo and Evernote, as well as co-founding PayPal, Levchin has seen firsthand the importance overall customer experience plays in a successful business. And in the highly skeptical market of consumer credit, customer experience and brand transparency plays an even bigger role to a business’ bottom line. For Affirm’s business leaders, NPS was identified as the best opportunity for both the brand and its consumers to benefit from transparency and the reassurance that Affirm will do right by their customer:
We started using NPS to gauge our customer’s overall experience with our service and whether or not their experience warranted their desire to recommend us to their friends and families. NPS is also another way to keep us in check with our company’s core values. Prior to NPS, we did not have a system in place to gauge this data. Apart from anecdotal interviews, we did not have a consistent and reliable source from which we could learn and grow.
Brand transparency and what Levchin calls “fair and honest financing” is a core value for Affirm. Brand transparency is also the key to differentiating Affirm from other credit options as customers are given the total loan amount upfront, including interest. Affirm also never charges late or penalty fees of any kind. Affirm is a firm believer that companies need to be transparent about their NPS because it’s a good indicator of how satisfied a company’s customers are with the service being provided.
As such, a company’s NPS shows customers how well that company has delivered on their brand promise. Affirm boasts an NPS of +83, a score the company attributes to delivering on their mission of providing consumers with honest, transparent financing. Affirm’s CEO regularly shares the company’s NPS results on social media, thus keeping its promise of brand and NPS transparency.
+83 NPS which the company attributes to delivering on their mission of providing consumers with honest, transparent financing
An NPS Program that Delivers Actionable Insights
In order to know how and why customers use their product, better understand the gaps in their product and service(s), and to keep in check with their core value of brand transparency, Affirm relies on NPS.
Affirm’s NPS program is run exclusively via email using a relationship NPS survey. The company sends 5,000 survey emails each week and receives a steady stream of customer feedback. The goal of Affirm’s NPS program is to keep track of customer happiness, understand their concerns, and address any issues that come up.
NPS allows us to identify improvements we could make to our product and enhance the customer experience, including billing reminders, payment process, checkout experience, and updates to FAQS. This was key as we pride ourselves on making everything we do completely transparent and honest as possible, including making complex concepts simple and clear.
Affirm is now available at more than 1,000 retailers and lets shoppers pay for purchases over 3, 6, or 12 month terms with its transparent, simple interest loan model. Because of consumers’ enthusiasm for honest fnancing and Affirm’s focus on customer experience, 25% of customers return to buy again.

Act: Closing the Loop & Optimizing
Annual Report
If you want to improve your customer experience, long-term revenue goals and Net Promoter Score, you need to act on customer feedback. Remember, NPS is an actionable metric, meaning that surveying your customers is only the first step. You also need to act on the feedback you receive. Companies do this by closing the loop with customers at different levels of their organization and optimizing business processes by setting realistic targets for future growth.
With structured processes, companies can address both operational and strategic issues as well as close the loop by communicating their actions and progress back to customers and internally to encourage best practices. Only by acting can you hope to begin improving your Net Promoter Score, raise retention and start building a network of promoters.
- Fixing detraction issues reduces churn and creates higher retention
- Companies should try and close the loop at the frontline, management and executive level.
- Companies that set goals and targets increase their Net Promoter Score and retention and reduce churn.
- Companies that don’t set goals will experience higher churn.
Companies That Close Increase Retention, Companies That Don't Increase Churn
You can close the loop at three levels: the frontline, with management and with executive management. Closing the loop helps companies rescue detractors (and passives) from churning and may help mobilize promoters to refer as well. (Tip: If you want referrals, it helps to ask.)
90% of companies close the loop in some way and with higher retention as a result. However, companies that don’t close the loop at all increase their churn a minimum of 2.1% per year. Companies who close the loop at every level maximize retention (greater than 2.1% per year).

Spotlight: Salesforce
Industry: Technology
Salesforce.com, Inc. is an American cloud computing company headquartered in San Francisco, California.
The Importance Of Listening to Promoters & Detractors
Any company that clearly understands the needs of customers and methodically focuses on how to meet those needs quickly stands out from the competition. The tech giant Salesforce is doing a tremendous job at understanding and meeting customers’ expectations. Headquartered in San Francisco, Salesforce is the global leader in customer relationship management (CRM).
The Salesforce Customer Success Platform includes industry-leading services spanning sales, service, marketing, commerce, communities, collaboration and industries, all on a single trusted cloud platform. However, what caught our attention is Salesforce’s customer churn rate, which is consistently less than 10%.
In order to better understand what drives such a tremendous retention rate, CustomerGauge reached out directly to the source. CustomerGauge sat down with Vice President, Customer and Market Insights at Salesforce, Karen Mangia. Karen engages a global customer set to fnd new ways of improving the customer experience at Salesforce. Her team’s work regarding customer feedback is central to product development, marketing and branding. Karen shared with CustomerGauge how Salesforce uses the Net Promoter Score to better understand their competitive positioning in the market and align customer needs with business goals.
Salesforce uses NPS in three key ways to make better business decisions, increase customer
satisfaction and ultimately retention rates.
NPS Benchmarking
Companies with mature NPS programs make it a habit to compare themselves to top-performers in the same industry. Salesforce’s Customer & Market Insights team makes sure that the company not only has a robust understanding of a customer’s level of loyalty and drivers of NPS, but also an idea of how their NPS score compares to other industry leaders. As a result of NPS benchmarking, Salesforce gets a reality check on what the average NPS score is for their competitors and others in the industry. The company is also fully equipped to understand the drivers of NPS and ways to improve. Salesforce then prioritizes the initiatives that will enable them to deliver on their customers’ expectations.
Break NPS Down to Job Role
As per their 2017 Annual Report, Salesforce now has more than 150,000 customers. The company’s customer list is extremely diverse, ranging from small companies to Fortune 500 companies. Its solutions take advantage of the latest advances in cloud, social, mobile, Internet of Things and artificial intelligence technologies.

Salesforce’s customers are as diverse as their products, with roles in sales, marketing, service, commerce, operations and IT. Having such a diverse customer base means that Salesforce users have different needs and expectations across job levels and roles. Karen shared that
Salesforce’s high customer retention rates do not happen by chance. The company has invested heavily in drilling down to the drivers of customer satisfaction, customer loyalty and likelihood to recommend.
When analyzing their NPS results, the Salesforce Customer & Market Insights team analyzes the results by role, job level, geography and where they are in their customer journey. In this way, the company is better equipped to understand how it is doing for those specific customer groups to ensure needs and expectations are met. As a result, Salesforce can easily tailor and prioritize how the company takes action.
Follow Up with Both Promoters and Detractors
Salesforce’s closed-loop process proves that the company clearly understands that NPS is so much more than just a number. Karen shared with CustomerGauge the lengths to which the company is going in order to get the full picture of a customer’s likelihood to recommend.
After the completion of a customer survey, Salesforce looks at the NPS score and starts a follow-up process with respondents. Salesforce’s closed-loop method includes:

What was fascinating to learn is that based on their analysis, Salesforce found out that sometimes the same drivers of promotion can also be the same drivers of detraction. That is why it is important for Karen and the Customer & Market Insights team at Salesforce to dive into when a driver causes a customer to become a promoter vs. what are the circumstances that cause the very same driver to make a customer a detractor. The four follow-up methods mentioned above help Salesforce obtain additional context and thus make better business decisions.
Salesforce’s impressive customer retention rate clearly shows the company is extremely well-equipped at meeting customers’ needs. The longer customers are loyal to Salesforce products, the greater the company’s competitive advantage becomes.
Closing The Loop At The Frontline
The frontline plays an indispensable role in retaining customers. At the frontline level, companies should close the loop with individual respondents and accounts. Companies that do so:
• Solve service issues fast to avoid detraction
• Understand root causes of issues to improve customer experiences and avoid repeated
detraction and help create more promoters
• Mobilize promoters to refer their brand
When it comes to closing the loop at the frontline, speed does matter. Getting back to customers while the survey and answer is still in their mind helps rescue detractors from defecting. Based on responses, companies that close the loop within 48 hours experience the highest increase in retention.

Closing The Loop At The Management Level
Management must close the loop by:
• Analyzing root causes and determining which issues to prioritize and improve
• Comparing results across segments, e.g. products, organizational units or employees to determine top performers and best practices
• Ensuring that best practices are indeed shared to the appropriate people and departments across a company
Companies whose management share best practices across their organization experience higher rates of retention (greater than 2.2%). For global companies that measure Net Promoter Scores across regions, sharing best practices can have a huge impact on raising scores and removing pain points.

Closing The Loop At The Executive Level
The purpose of closing the loop at this level is to ensure long-term customer experience improvements and maintain buy-in from both customers and employees. Lack of buy-in from employees can quickly stall a Net Promoter program. In CustomerGauge’s 2016 survey, 23% of companies found c-suite buying to be the primary factor behind the success of their NPS program.
23% of companies in CustomerGauge’s 2016 survey found c-suite buy-in to be the primary factor behind the success of their NPS program
Throughout this report, you’ll find a number of company spotlights that highlight how important buy-in became to the success of each company’s NPS program. Many of these organizations’ programs were spearheaded by executives.

Spotlight: Colliers International
Industry: Real Estate
Colliers International Group Inc. provides commercial real estate services to corporations, financial institutions, governments, and individuals worldwide. The company was founded in 1972 and is based in Toronto, Canada.
What 10 Years Of Using NPS Has Taught Colliers
As Canada’s largest specialist project management firm, Colliers Project Leaders have a long history of providing customer service excellence. Serving impressive brand names such as Canon, Canadian Tire and SaskPower, its ongoing metric to measure customer satisfaction and brand advocacy needs to be fast, simple and efficient. Prior to implementing NPS, the company had a quality management system that allowed it to track complaints and identify the root causes of dissatisfaction. In 2007, Colliers Project Leaders moved towards an advanced understanding of its customers’ needs and proactively meeting their expectations. That year, they decided to implement the Net Promoter System.
Here’s what 10 years of using NPS has taught Colliers Project Leaders:
NPS Management Buy-In Speeds Up the Culture Transformation
From the start, NPS received senior management buy-in; the program was introduced by the real estate giant Colliers International, which bought a share of Colliers Project Leaders in 2007. NPS was already ubiquitous at Colliers International. The president championed the metric, and bonuses for executives and senior management were tied to the company’s NPS performance. Spurred on by Colliers International’s example, Colliers Project Leaders’ executives enthusiastically implemented NPS at their own company. C-suite NPS buy-in ensures that all departments adopt the practice, and NPS is applicable to each facet of the business, from frontline employees to CEOs.
Identify the Feedback Channel and Frequency that Delivers the Highest Response Rate
A Net Promoter program is not meant to replicate market research with long, tiresome or even typically infrequent surveys. Instead, the aim is to continuously listen, capture issues fast and resolve them. One of the first steps is to determine the feedback collection channel and how often you send surveys. There are numerous ways to capture customer feedback—email, phone, website, SMS, in-app, etc.—so companies need to find the channel that provides them with the highest response rate.
We experimented with an online survey, but our response rates dropped from 50-60% to 30%, so we returned to letter mail.
Colliers Project Leaders use direct postal mail to collect customer feedback. The request for feedback comes with an introductory letter signed by the president and a stamped self-addressed envelope. The NPS team follows up with the client if they don’t get a response within a month. Colliers Project Leaders have tried some of the most popular feedback channels, including email and website surveys. After an A/B test, and knowing their customers well, they confirmed that direct postal mail had the highest response rate.
Colliers Project Leaders collect feedback for each project once a year. Construction projects take months to complete, so one relationship NPS survey a year is good practice. The company also sends out transactional NPS surveys. Colliers Project Leaders also asks some high-volume clients to rate each project manager on the project team once or twice a year.

The Key to NPS Program Success is the Internal Sharing of Results
Sharing scores, results and actions internally is a key ingredient to the success of any NPS program. Colliers Project Leaders create engagement and organizational support with NPS results:
Frontline
At the frontline level, every detractor survey result is immediately reviewed with the relevant business unit vice president and project team to identify the root cause of the problem and remedial actions. This often involves a discussion with the client to understand their perspective. Also at the frontline level, each staf member receives an exemplary performance rating that includes an assessment of their Net Promoter Scores.
Management
At the management level, each business unit vice president receives a monthly dashboard reporting their performance results. The professional practice manager reports monthly on detractors and lessons learned that can benefit the rest of the company.
Executives
Colliers Project Leaders’ executives also receive the monthly dashboard and detractor reports. The professional practice manager releases an annual report on the effectiveness of the quality management system, including any changes in process to improve client satisfaction. In his client survey request letter, the president offers to call clients to review his team’s performance, and follows up as needed.
CustomerGauge asked Colliers Project Leaders to share their favorite NPS story. Here’s a short example on the power of NPS:
Colliers won a new client on a multi-year contract that would contribute to about 25% of the revenue for one business unit. Their survey results after the first year were uniformly detractor results (5 or 6). In response to the survey results, the business unit VP met with the client to learn how they could serve them better.
- Refined some business processes to produce better deliverables
- Agreed to revise the survey approach to score each of the project managers assigned to the client
- Developed a regular touchpoint between the client and their business unit VP
The results of this follow-through were exceptional. After six months, all project managers scored 8 or 9, and after 12 months all scores were promoters (9 or 10). The project team members now have a clear idea of what it takes to satisfy the client and take pride in their ability to do so. - Colliers Project Leaders, NPS team
To Succeed You Need Goals
To optimize the ‘Act’ phase, it’s important to set and track realistic targets, which 2 out of 3 companies in the study currently do.
Based on responses, CustomerGauge found that:
• Companies that set Net Promoter targets every year also achieved better than average retention gains.
• Companies that didn’t set Net Promoter targets hardly improved their retention. It was surprising to see that this included companies with older programs (average program age for respondents is 3 years).

Setting S.M.A.R.T. Targets:
When you set targets, ideally every target should be S.M.A.R.T. This acronym stands for:
S-Specific
That is, target a specific area for improvement.
M-Measurable
You should quantify or at least suggest an indicator of progress.
A-Assignable
Specify who is responsible for the target.
R-Realistic
State what results can realistically be achieved, given the available resources.
T-Time-Related
Specify when the target can be achieved and if there are any milestones that need to be met.
Grow: Monetizing Referrals, Up-Sales, Cross-Sales And More
Annual Report
Growing retention includes predicting the likelihood of churn and then segmenting customers according to their value and churn probability. For each segment, companies should then define which activities to carry out. Referral marketing, in combination with Net Promoter, is a powerful tool to grow referral business. The concept allows companies to know which customers are likely to refer their business and then incentivizes them to do so.
- Once an NPS program matures, companies must establish a link between NPS and customer loyalty growth factors like retention rates, referral sales rates and up-/cross-sales rates.
- It’s 5 to 25x more expensive to attract a new customer than to retain one. However, many companies still don’t know their retention rates.
- The best companies report retention rates above 95%. But many industries contain companies with retention rates below 50%, meaning there is still room for substantial retention revenue growth.
Monetizing NPS
The objective of monetizing NPS is to determine how NPS impacts growth. CustomerGauge asked if people had established a link between NPS and future revenue. As shown, the more a program matured, the larger the percentage of companies were able to establish a link.

Many companies only look at NPS and total revenue, but the task is to establish the link between NPS and customer loyalty growth factors like retention rates, referral sales rates and up-/cross sales rates.

Spotlight: Micro Focus
Industry: Technology
Micro Focus International is a multinational software and information technology business based in Newbury, Berkshire, England. Micro Focus and HPE Software have joined to become one of the largest pure-play software companies in the world.
How The Seventh Largest Software Company In The World Uses NPS
On September 1, 2017, a merger was completed between Micro Focus and Hewlett Packard Enterprise Software. The combined company became the seventh largest pure-play software company, and the UK’s largest technology firm listed on the London Stock Exchange. The company relies on the Net Promoter System as the primary way to measure customer loyalty within Micro Focus. NPS was introduced by Meg Whitman, CEO of HPE, who brought the system with her from her time as President and CEO of eBay. Since then, NPS has become a ubiquitous metric throughout Hewlett Packard Enterprise, which later became Micro Focus. The result? Micro Focus has successfully moved NPS beyond just a metric by correlating it to future revenue.
Here’s what you can learn from Micro Focus’ NPS program:
Survey Frequency and Setting Clear Targets for Your NPS Program Cannot be Overstated
Elevating a company’s NPS score requires using best practices on survey frequency and clear NPS program targets. Micro Focus surveys customers on a quarterly and biannual basis. As such, the company asks customers to answer the main NPS question: “How likely would you be to recommend Micro Focus to your colleagues?”
Ultimately, our goal at Micro Focus is to increase NPS, and subsequently better deliver on our promise to place the customer at the center of what we do.
This is followed up with two verbatim questions:

Micro Focus keeps surveys short and simple to improve verbatim feedback and customer happiness. In their research, CustomerGauge has found that every extra question drives down response rates between 5-15%.
5-15% response rate decrease for every extra question
Micro Focus does not focus too much on the numerical value of NPS. What matters to the company is the actionable insight that they can act on, and where they stand in relation to their competitors. Micro Focus’ NPS goal is to always listen to their customers who have provided responses to the verbatim questions “Why?” and “What should be improved?”. The company found that customers that cared about the relationship took the time to respond. Furthermore, customers that cared the most were prepared to write longer responses and provided thoughtful input. To Micro Focus, anyone who provides suggestions is a potential promoter, regardless of their present status.
We always wish to ensure constant feedback loops between customers and those stakeholders involved in product development, marketing, product management, and sales.
Linking NPS and Revenue Makes People Sit Up Straight
CustomerGauge has found that a key reason why NPS programs fail is because the c-suite is not convinced that NPS is connected to revenue. Micro Focus are among those companies that have made the link between NPS and business revenue.
NPS has always been top-of-mind at Micro Focus. The company’s NPS team highlights the areas that will increase Micro Focus’ NPS and what effect that would have on their revenue to top management. Micro Focus puts NPS into action by using it to influence marketing plans and strategies, and even product roadmaps.
I find that linking NPS and revenue makes people sit up straight, and moves the conversation from “just a metric,” to strategic responses and actions. I can say that, like CustomerGauge, I am an advocate of correlating Net Promoter with revenue, and have solidified and refined this methodology.
Talk to Your Passives
According to Micro Focus, passives may represent around 40% of the customer base in a B2B setting, and are the category most likely to churn. Companies with a mature and robust Net Promoter System pay a lot of attention to their detractors and as such work on turning them into promoters with time. Equally, promoters should be engaged and leveraged to refer a brand through referral marketing, coupon campaigns, etc. Passives, however, are just as critical to the success of an NPS campaign. Because passives are not included in the NPS formula, they can be easily overlooked. They will leave companies silently if they aren’t treated with the same level of responsibility as a detractor.“
Measuring Retention Is Imperative
For the second year in row, it was found that a shockingly high number of companies can’t report how many customers they are losing annually. In fact, 44% of respondents didn’t know their retention rate. For senior management the number is 32%, which strongly suggests that 1 in 3 companies don’t know their retention. This shows that senior management may not be transparent about the retention rate with staff or other departments, which can ultimately lead to knowledge gaps within the data.
Studies have shown that it’s 5 to 25x more expensive to attract a new customer than to retain one, so knowing your retention rate is an imperative in today’s business. Some companies may struggle to define retention, e.g. in non-contractual business settings, but a simple definition is better than none and still one that can be refined. As a start, CustomerGauge often suggests that a customer with no purchases for the last 12 months should be considered a churned customer.

Room For Higher Retention
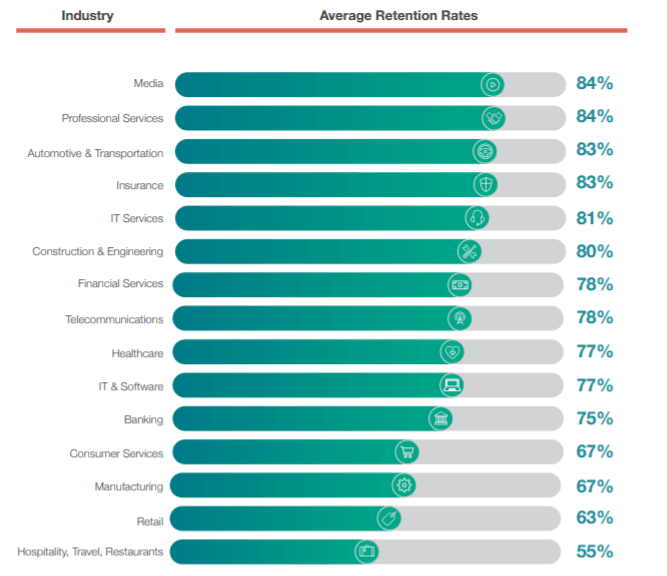
Most industries contain companies with retention rates below 50%, as well as above 95%. This implies that many companies can improve retention. An increase of revenue retention by 5% means that revenues grow by at least the same 5% since retained customer may also buy more. This means the more customers that can be retained, the more revenue can be increased.
Fred Reichheld showed that a 5% increase in retention corresponds to a 25% - 95% profit increase. The industries listed below are discussed on a deeper level later in the report, specifically concerning trends in retention, NPS and innovation.
Spotlight:Vodafone
Industry: Telecommunications
Vodafone Group plc is a British multinational telecommunications company, with headquarters in London. It predominantly operates services in the regions of Asia, Africa, Europe, and Oceania.
Vodafone Increases Customer Retention By Acting On Customer Feedback
Propelled by its dual focus on the customer and innovation, Vodafone New Zealand decided to implement an actionable metric that provides valuable insight about the health of their customer relationships. Before implementing the Net Promoter Score in 2009, Vodafone NZ relied on the “Total Delight Index”, which was not empowering the company to act on customer feedback and increase customer satisfaction. Following the implementation of the Net Promoter System, the company was able to collect customer feedback covering its 3.7 million customers nationwide and track it in real time. More importantly, Vodafone NZ could also now act on feedback across multiple channels, including e-commerce and in-store purchasing. The result? Vodafone NZ was able to increase its customer retention rate and drive the VoC into all areas of its business.
Here are three NPS best practices you can learn from Vodafone NZ:
Establish Organizational Support
Visible leadership endorsement is the single most important factor that makes or breaks any customer experience program.
Companies that lack support at all organizational levels really struggle to increase retention and may, as previously implied, incur churn. Whereas companies with full support at all levels thrive. As such, establishing organizational support is key to a successful Net Promoter program. Vodafone NZ is a paramount example of getting management buy-in and establishing cross-functional leadership.
From the start, Vodafone NZ directors conducted a two-day customer experience training course for the whole organization, emphasizing the benefits of NPS and how the program will help Vodafone NZ get closer to customers. Employees from all levels of the company understood that NPS is very much a cross-organizational responsibility. Continuously communicating NPS results and setting targets is important for keeping organizational focus.
Vodafone NZ also established “leaders” among its employees, who were sent on an NPS certification course to become experts and ambassadors of Net Promoter. Their role then grew to continuously drive and support cross-functional NPS programs nationwide.
Map The Customer Journey & Identify the Best Feedback Channels
Delivering a stellar customer experience to 3.7 million customers meant that Vodafone NZ had to identify the key customer touch points that make or break the customer experience. Vodafone NZ had to then understand which feedback channels would trigger the highest response rates and work best for B2B and B2C customers. Starting with mapping the customer journey, Vodafone NZ was able to list all known customer interactions and group them into the major touch points, such as the Contact Centre and Retail touch points. Furthermore, the company was able to apply best practices by knowing where transactional and relationship surveys would make more sense. Companies using both relationship and transactional surveys improve retention more than companies using one survey type.
For its enterprise clients, Vodafone NZ uses both relationship and transactional NPS surveys. Relationship NPS surveys allow Vodafone NZ to capture its enterprise customers’ overall experience with a company. This experience is formed by all interactions (or touch points) a
customer has with Vodafone NZ in the customer journey. The company’s account managers send relationship NPS surveys to enterprise customers every couple of months.
Vodafone NZ has also identified that the best feedback collection method for enterprise accounts is email, as SMS can be perceived to be too intrusive. Transactional NPS surveys allow Vodafone NZ to measure the performance of customer touch points. These key insights
are used for coaching customer-facing teams to further improve and deliver good service experiences.
From a financial perspective, the most successful Net Promoter programs use short and frequent relationship surveys. Vodafone NZ sends 4 questions per survey via SMS and email. As a result, the company is able to identify how many customers are at risk of churning and drill down to the drivers of satisfaction such as network performance, customer service and product satisfaction. Armed with such insights, Vodafone NZ is able to make better informed business decisions about its services in order to increase retention.
On a transactional level, the company also sends an SMS survey to consumers within 24 hours of them making a purchase in store. The same is applied if consumers have spoken to a contact center representative. In this way, the Vodafone NZ teams are able to drive improvements in these key customer touch points. Acting on customer feedback for the top customer pain points has a massive impact on retention.
NPS is About Acting, Not Just Measuring
Acting on collected insights from customers, also known as closing the loop, is essential to improving the Net Promoter Score. And Vodafone NZ has seen first-hand the impact of closing the loop on their bottom line—responding to customer feedback within 48 hours has reduced the churn rate. Vodafone NZ closes the loop for both B2C and B2B customers. Frontline management calls back respondents to ask for the root cause of the Net Promoter Score if it is unclear and fix open issues with detractors. Vodafone NZ shares that phoning detractors within 48 hours adds an element of surprise and shows the company actually listens to customers. The result? Customer retention has increased.
We selected NPS because it is simple for everyone to understand so instead of spending a disproportionate amount of time on complex mathematical formulas, we spend most of our efforts on actioning real experience improvements for our customers.
The company also does a rigorous analysis on the NPS drivers for their business function including what to improve to grow NPS. Reviewing scores, drivers and comments from enterprise clients allows Vodafone NZ’s account managers to prioritize and agree on actions with the client to followup later.
Correlate Sales Revenue To Referrals
Net Promoter practitioners understand that loyal customers (i.e., promoters) are more likely to refer new customers. An important step is to identify which of your customers are willing to refer, and what it will take to get a referral. After that, it’s important to determine:
• How much referrals affect sales and the sales process
• How much revenue referrals generate
The below chart displays the percentage share of respondents (x-axis) by the referral sales rate ranges (y-axis). In the survey, 2 out of 3 companies registered if a sales win came from a referral, though very few could answer if the referrer was a promoter, passive, or detractor. Since one of the purposes of running a Net Promoter program is to create more referral business, it’s remarkable that so few companies track if they succeed. One likely reason is that few CRM systems are set up to link sales and Net Promoter data, however many companies also don’t track which customers refer new business.

More than half of all companies had a referral sales rate less than 10%. Obviously, this can be due to a lack of promoters, but when examining the Net Promoter Scores, there was no correlation found between NPS and referral sales rates. The only group with higher Net Promoter Scores were companies with a referral sales rate above 50%, but the other groups had nearly the same average scores, all with high standard deviations. Some companies manage to create more referral business than others, which indicates a large growth potential.
Referral Marketing=Revenue Growth
Referral marketing is a new buzzword, but does it really work?
When referral marketing is linked to your Net Promoter program, you can better target your promoters for campaigns. The chart shows a significant improvement. Not every additional point of the referral sales rate turns into revenue growth, as some customers may buy despite the referral. CustomerGauge did, however, find a strong relationship between the referral sales rate and a company’s revenue growth.

Some companies assume that simply having promoters is an indication of future referrals. However, this is far from the truth. Businesses need to link referral marketing (reaching out and ASKING customers to refer) with their NPS and customer satisfaction programs.
Retention Sales Growth
What type of growth should companies attempt to achieve? Since the highest quality, safest, and most stable dividend-paying stocks have tended to provide 10% in yearly returns to owners for centuries, it seems that investors are willing to invest their money with this return in mind. Of course, investors will demand higher returns on investments in startups due to a higher risk of failure but, in general, companies must deliver double-digit growth to satisfy investors. Many companies fail, however, to grow the revenue of existing customers at such rates and must compensate by attracting new customers. In the study, 41% of companies grew their existing customer base less than 10%.
If companies use their Net Promoter program to retain 95% or more of their customers, with the intention of selling more to them, achieving double-digit growth becomes a lot easier…and cheaper. Attracting new customers is at least 5x more expensive than selling to existing customers, for which reason a switch from acquiring new customers to retention and up-/cross sales improves margins.
The chart below displays the revenue growth reported by responders. If the retention rate is 90% and the up-/cross sales rate is 15%, the revenue growth of the existing customer base is 5%.The general perception is that top performers have a retention growth of at least 10% (sometimes referred to as negative churn)—something that 17% of companies in the study achieved. In other words, 1 in 6 companies in the study achieved two-digit growth without acquiring new customers.
How Monetized NPS Impacts Growth
The Monetized Net Promoter model describes best practices and groups them into three levels of increasing maturity: Measure, Act, and Grow. 41% of surveyed companies only follow the best practices on the first level but don’t act, at least not consistently, on customer feedback. The findings show how the different levels of maturity impacted customer loyalty behaviors: retention, up- and cross-sales and referral business. The following chart illustrates the increases in the loyalty metrics.
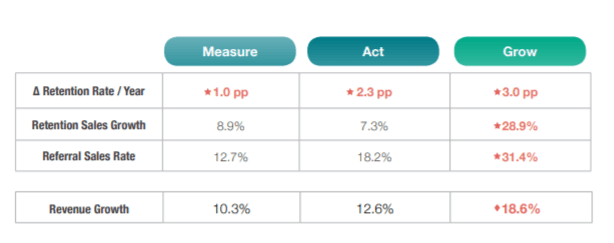
Best practices on the “Act” level only serve to stem churn. That the retention rate improves by 1.3% points per year is not a surprise, as closing the loop in a Net Promoter program is a straightforward method to salvage detractors and prevent them from churning.
However, what may be surprising to some is that no significant change was found in retention sales growth and referral sales rates on this level compared to the “Measure” level. Many Net Promoter practitioners believe that higher Net Promoter Scores lead to more up-/cross-sales and referrals, but this is not always the case.
Up-/Cross-Sales & Referral Marketing
Best practices on the “Grow” level improve all customer loyalty metrics significantly. The yearly retention rate improves an additional 0.7% point compared to those companies only on the “Act” level. The likely reason is that the focus moves from merely improving the Net Promoter Score to also improving retention, for instance, by understanding the drivers of retention/churn.
Both the retention sales growth and the referral sales rate improve considerably for Net Promoter programs on the “Grow” level. Companies experience a remarkable 20% increase in up-/cross sales growth at this level.

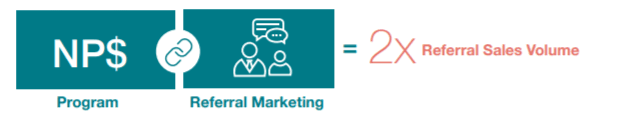
In addition, companies that link their Net Promoter program to a referral marketing program achieve nearly double the referral sales volume. CustomerGauge also investigated how the NPS maturity level of a company impacted revenue growth. Revenue growth increases with higher retention rates, more up-/cross sales, and an activation of promoters to refer.
However, companies that don’t focus on these metrics may compensate by acquiring more
new customers. Other strategies such as disrupting an industry with new digital solutions may
also increase revenue growth.
The results were not as significant for the revenue growth metric, though the numbers indicate that the Monetized NPS model does have a positive impact. Improved customer loyalty is, of course, not the only path to higher revenue growth. However, the Monetized Net Promoter methodology does improve several factors that contribute to it. Companies that don’t pursue the opportunities in a (monetized) Net Promoter System overlook some obvious and easy opportunities to achieve higher growth.
Industry Overviews
Annual Report
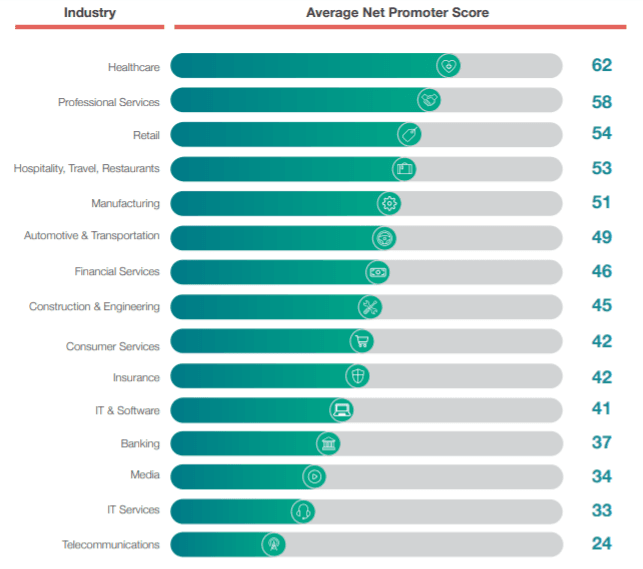
From automotive to telecom—this year, there were a large range of industries who participated in the survey. To get a state of the Net Promoter and customer experience landscape, CustomerGauge looked at cross-industry averages in NPS, retention and return on retention.
Note: The Net Promoter and retention numbers are based on statistically significant data provided by surveyed customers. All Net Promoter Scores are self-reported from surveyed customers and averaged based on those provided numbers. The following section provides additional context and information on industry trends and their potential correlation to the finding. On the industry pages, the data compares the average Net Promoter Scores at the start of Net Promoter programs to the present average Net Promoter Scores reported within industries.
Transportation & Automotive
Average NPS Score at Start of Programs: 33
Current Average NPS Score: 49
Average Retention Rate: 83%
Average Return on Retention: 93%
Automotive and transportation, maybe more so than most industries, relies heavily on a fan base of generational consumers. If companies are able to keep pace with the more omni-channel nature of not only their products, but their customer journey, you can expect to see a similar rise in Net Promoter Score over the next three years (+16).
The automotive and transportation industry is undergoing continued disruption from new mobility innovations and products. According to McKinsey, by 2030 up to 15% of new cars sold could be fully autonomous. In the meantime, features that offer full connectivity and customization will be in high demand as consumers continue to request feature-rich options to improve their journeys.
By 2030 up to 15% of new cars sold could be fully autonomous.
The industry can increase customer retention by better managing the customer lifecycle and improving a sense of transparency among customers. Purchasing a car is one of the biggest financial endeavours many consumers will make. Post-sale and services build longer loyalty and promotion, and is the most important time for companies to monetize their customer experience through up-sells, cross-sells and more. Therefore, a great customer experience must extend to all touch points. Having verified and accountable points of contact for customers throughout the customer journey can greatly improve retention and loyalty as it makes consumers feel cared for during a relatively stressful ownership process. In fact, 72% of consumers said that an improved buying process would motivate them to visit dealerships more frequently.

Banking
Average NPS Score at Start of Programs: 25
Current Average NPS Score: 37
Average Retention Rate: 75%
Average Return on Retention: 83%
Digital transformation has shifted consumer standards in terms of what customers expect in their interactions with businesses. Maybe nowhere is this changing landscape felt more than the banking industry. According to Adobe, 63% of financial service executives believe customer experience to be a top priority for their business.
This correlates with what CustomerGauge saw in the average scores of the industry. While the industry has increased their NPS scores by +12, there is still a good amount of room to improve. At a retention rate below average, the banking industry should focus on new CX initiatives to give themselves the competitive edge:
• Improved digital experience: 46% of consumers primarily interact with their bank digitally. Like many other industries mentioned, traditional banking institutions need to provide continued omni-channel conveniences that offer ease-of-use.
• Additional consulting services: Many banking companies are beginning to invest in services that provide added business value to customers, such as coaching, career planning, etc. Barclays, for example, introduced “Barclays Eagle Labs” as a community resource for small businesses and innovators in branches throughout the UK. This type of retention strategy works on foresight: a customer’s future success is your future success. This correlates to the return on retention seen within the industry.
• Conveying empathy by problem solving: The reason traditional banks like USAA experience such high retention and customer loyalty (NPS 75) is something mostly unheard of in banking: empathy. As financial representatives of a large portion of American veterans, USAA has continued to build a reputation, not just in persona but in practice, as an institution of empathy. Whether it be through extensive customer care training or technological innovations that improve the customer journey.
Consumer Services
Average NPS Score at Start of Programs: 41
Current Average NPS Score: 42
Average Retention Rate: 67%
Average Return on Retention: 79%
Like the retail industry, consumer services suffer from a below average retention rate. Many consumer brands have difficulty tracking consumer churn, especially in the B2C space. Better tracking of retention and churn metrics can improve targeted retention marketing practices.
Some high Net Promoter Scores do appear in the consumer brands space, according to NPSBenchmarks.com: Apple MacBooks (NPS 76), Tesla Motors (NPS 97), Amazon (NPS 61) are among them. However, benchmarks within the industry vary greatly. One example company nailing the ROI of CX is, unsurprisingly, Amazon. Amazon continues to create a loyal following through an increasingly innovative digital channel and member benefits, such as Prime, that create lasting loyalty.
In fact, not only do Amazon Prime members stay longer, with 91% of Amazon Prime members subscribing for a second year, but they spend more—around 42% more than regular Amazon consumers. Like Amazon, after improving the tracking of retention and churn metrics, consumer services should focus on building retention benefits and services.

The fact that consumer services have only improved their NPS score by +1 from the start of their program shouldn’t discourage companies. When beginning an NPS program, companies will start to survey a larger sample size of their customer base, and therefore may be working with more detractors than previously thought. Focusing on your own internal benchmarks is the first step for building a better loyalty program and benefits relevant to your type of customer.
Financial Services
Average NPS Score at Start of Programs: 30
Current Average NPS Score: 46
Average Retention Rate: 78%
Average Return on Retention: 88%
The financial services industry has seen improved retention and returns as an industry by harnessing technological innovations to improve customer experiences. The fintech subindustry, in particular, leads the pack in this push. In EY’s most recent report, Customer Experience: Innovate like FinTech, they found that 71% of customers said that technology has made it easier to have products across multiple financial providers.
71% of customers said that technology has made it easier to have products across multiple financial providers.
To remain competitive financial service companies should innovate like fintech, including implementing best practices in improving retention:
- Better multi-channel experience
- Easier account setup
- Improved customer service
- Increased access to resources
- Diversified & transparent rates
For traditional financial services companies, the name of the game is simplification and added value. Organizations should seek to simplify pricing structures (i.e., transparency), product portfolios and features. In the B2B realm, financial companies should look at counseling or mentorship services to increase retention among businesses to experience continued growth and retention returns among clients. You can learn more about how financial service companies can better navigate their NPS programs in CustomerGauge’s financial services field guide.
Healthcare
Average NPS Score at Start of Programs: 53
Current Average NPS Score: 62
Average Retention Rate: 77%
Average Return on Retention: 96%
Healthcare is another industry that has been impacted by disruptors, for example, in the form of urgent cares and the increasing demand of improved patient experiences. Consumers now feel they have options when it comes to their health. Like many other industries, a large part of who patients go with have to do with lifestyle convenience and experience-based services. Technology and catered services from the likes of urgent cares have changed traditional practices and impacted patient experience:
Appointments: Services like Zocdoc have provided ease in finding doctors and making appointments (without the need for outdated and antiquated insurance provider search platforms). This convenience has led to a rise in private healthcare providers investing in telehealth technology.
Check-in: Long form filing and repetitive information exchange have been replaced with pre-аppointment digital forms that ease the check-in process and reduce wait times.
Price transparency: Urgent cares have changed non-emergency health services. Patients now have the ability to compare prices for services across urgent cares.
Urgent care and minute clinics should continue to leverage technologies, price transparency and customer experience metrics to drive strategic growth and improved CX. A good example of one urgent care who has seen substantial growth by harnessing NPS is Legacy ER & Urgent Care. In 2017, they projected to grow their revenue 200% from existing patients alone and are poised to expand:
We’ve taken everything that healthcare typically does [when it comes to patient satisfaction and patient experience] and thrown it out the window. It’s a complete transition away from a typical healthcare experience. Our NPS score and patient experience comes from the whole package. Before patients are even done checking in, somebody is greeting them in the room and bringing them in. We’re aware that a majority of the people we see are probably having a bad day, so it’s important to set that initial tone very high, even when people first walk in.
Hospitality, Travel, Restaurants
Average NPS Score at Start of Programs: 48
Current Average NPS Score: 53
Average Retention Rate: 55%
Average Return on Retention: 61%
The hospitality industry is heavily impacted by the ebbs and flows of consumers’ economic conditions. Because of this, hospitality and travel typically compete equally on experience and price. In fact, according to Deloitte, economic conditions are a key driver of growth within the industry. In addition, travel has taken a beating over the last year in the PR department, where consumers have become wary of the high-ticket prices and poor treatment.
Both the hospitality and travel industry, therefore, are faring with a highly competitive landscape where the best deal is a combination of price and improved experience. According to NPSBenchmarks.com, companies like JetBlue (NPS 59) and Southwest (NPS 62) are combining both of these concepts together to offer travellers the lowest price, but at peak experiences. In addition, restaurants are growing at twice the rate of the population in the United States alone. While this translates into more economic growth, it equals greater competition for those within the industry.

As an industry that often deals in high-stress situations, empathy will play a bit part in differentiating brands from their competitors. To improve retention and their Net Promoter Scores, the industry as whole should determine what drivers contribute to detraction the most among their customers, and use that information to build better loyalty programs, inform referral marketing efforts and improve baseline experiences.
Insurance
Average NPS Score at Start of Programs: 30
Current Average NPS Score: 42
Average Retention Rate: 83%
Average Return on Retention: 89%
Whether health or auto insurance, emotions run high, and the customer journey is a defining factor in how a consumer perceives their relationship with an insurer. Insurers need to get better at focusing on the journey as a whole as opposed to individual moving pieces.
McKinsey’s report “The Growth Engine: Superior Customer Experience in Insurance”, stresses the importance of perspective in understanding empathy in the customer journey. In the event of an auto accident, customers will always draw a distinction between an agent and a claim’s adjuster. For insurers, both of these roles remain the same: representatives of their companies.
While retention can be a tricky topic when it comes to insurance (especially in terms of health insurance, where consumers have restrictive options in providers), the current data is promising. The insurance industry is experiencing continued growth with a retention rate of 83%.

In the previously mentioned McKinsey report, research found that settlement amount meant significantly less to consumers in terms of satisfaction than the ease of tracking a claim status. Insurance companies should continue focusing on using both technology and improved employee training and empathy to streamline the customer journey. EY predicts, for example, that intelligent virtual assistants38 (IVA) can help revolutionize industries such as insurance to make tracking a claim as easy as talking to a personal home assistant.
IT & Software
Average NPS Score at Start of Programs: 34
Current Average NPS Score: 41
Average Retention Rate: 77%
Average Return on Retention: 87%
Since the 1980s, companies have gone from one-of software and hardware companies to complete solutions for every day needs. Adobe Systems are an example of this transformation. Once a boxed software company, Adobe’s business is now primarily driven by cloud-based subscription services, generating $1 billion+ in recurring revenue. More and more big name software and IT companies, like Adobe (i.e., SAP, Micro Focus and Sage), are seeing an increased importance in how metrics like NPS can be used as a vehicle for utilizing user feedback.

Handling user feedback in a growing portfolio of offerings can be difficult to manage. Using frequent transactional and relationship surveys with drivers can help address both of these issues for tech. Some of the most successful IT & Software vendors will combine NPS programs with customer service philosophies to help ingrain best practices into follow-up processes. SingleHop, a leading provider of Hosted Private Clouds and Managed Hosting, did just that by using their Net Promoter program to create a data-driven customer-centric approach, called “Service First”.
SingleHop has increased their retention by 50% within two years and was recently acquired by INAP for a 7x multiplier on revenue. The IT & Software industry should focus sharply on monitoring their engagement and retention metrics, and look for opportunities for growth via referral marketing, up-sells and cross-sells in their Net Promoter programs.
IT Services
Average NPS Score at Start of Programs: 11
Current Average NPS Score: 33
Average Retention Rate: 81%
Average Return on Retention: 89%
IT services has experienced the biggest jump in Net Promoter Scores in the industry list, with an average +22 NPS increase from their starting NPS score to present NPS score. The industry itself lives on the backbone of the personal and cloud computing boom, which has generated greater demand for expertise and guidance in everything from maintaining infrastructure to migrating to the cloud. Therefore, there is a strong driver for managing both the relationship side and technical expertise in a growing IT landscape.
Given the jump in NPS score from their program inception, it seems IT service companies are embracing more and more how trust, transparency and reliability play in customer satisfaction, more so than even IT efficiency.

In their report, “Measuring Satisfaction with IT Services Is a Key IT Metric,”Gartner stresses the importance for IT service managers to focus beyond just operational metrics and into direct user satisfaction.
While surveys can help take the temperature of these relationships, quarterly business reviews may help also address larger issues with key stakeholders.
Manufactoring
Average NPS Score at Start of Programs: 37
Current Average NPS Score: 51
Average Retention Rate: 67%
Average Return on Retention: 71%
There is no question that the manufacturing industry continues to be an economic force for both emerging and developing economies, with a 16% stake in the global GDP. Manufacturing is rapidly changing the supply chain game through digital transformation to increase efficiency, reduce workplace vulnerabilities and maximize production. But are these innovations being utilized to improve their B2B customer experience?
While digital transformation has allowed the industry to optimize costs, drive efficiencies and increase margins, many manufacturers still struggle to keep pace with translating these innovations into streamlined customer experiences, which is impacting their overall retention rate (67%) across the industry.
The manufacturing customer journey is a complex one. However, it’s a manufacturer’s job to reduce this complexity in the eyes of their customers. To improve retention and create differentiation from the competition, manufacturers need to begin looking at how they can use new technologies to reduce in journey complexities by providing tracking, increased transparency, better demand forecasting, etc.
Manufacturers should also focus on monetizing their NPS and CX programs by using tools like NPS SWOT to prioritize at-risk, high-value accounts, find opportunities for up-sells and cross-sells, etc.
A report from Microsoft found that the manufacturing industry is ripe for monetization opportunities: “Monetization of add-on services is one way that businesses can create mutual benefit for both sides of the relationship. These services, usually grounded in data and intelligence, typically provide customers with an aftermarket experience that adds value to the good or service. A good example of this is a predictive maintenance service. If a manufacturer can monitor the conditions under which a piece of equipment is operating, they can alert the operator of a potential failure before it happens. They could even dispatch a field agent to fix the source of the issue before a malfunction occurs, resulting in greater uptime and hence a better experience.”
Media
Average NPS Score at Start of Programs: 24
Current Average NPS Score: 34
Average Retention Rate: 84%
Average Return on Retention: 88%
Technology and consumer habits have transformed the media industry across all subindustries, from publishing to TV to advertising. The way customers think of content ownership, the impact of big data, content aggregation and the changing landscape of viewing and reading habits are just a few of the trends the industry is contending with. With about 60% of consumers now using streaming services monthly, companies such as Netflix and Hulu are seeing increased profits while also gathering a wealth of consumer data on viewing habits.

However, both streaming and traditional cable providers must track how content trends are affecting customer loyalty, something many are doing by combining consumer viewing data with metrics such as Net Promoter Score. Looking at the results of the survey, while retention within the industry is relatively good, it seems many providers come in at lower Net Promoter Scores.
According to Deloitte, companies must remember that while some streamers and media providers may be top dogs now, consumers are ripe for new content and therefore may be more susceptible to new competitors transitioning onto the market. In other words, as the industry changes, experience will become the true differentiator—meaning understanding what makes a loyal viewer, “loyal”, is more important than ever.
The publishing subindustry has additionally seen incredible change within their base due to a similar sentiment among customers on ideas of “ownership”. As another highly competitive market, experience plays a big role in retention among readers. To improve satisfaction among readers, publishers need to focus on how they can integrate current data sources (abandonment rates, subscription rates, click throughs, shares, etc.) and Net Promoter/satisfaction metrics to build a better retention strategy.
Professional Services
Average NPS Score at Start of Programs: 47
Current Average NPS Score: 58
Average Retention Rate: 84%
Average Return on Retention: 96%
According to a report by Accenture, the professional services industry is estimated to become the second-largest employment sector in the US, and currently accounts for 15% of the UK’s GDP. The Big Four accounting firms alone have a combined revenue of $120 billion.

Professional services is an industry created in response to continued disruptors across technology, guidelines, accounting, and skill shortages. As such, the industry as a whole has experienced continued demand and growth.

The professional services industry will transition to more preventative offerings due to technological automation, which will increase the need for better customer experience and relationship management within the industry itself. In fact, customer experience will become, for many sectors within the professional service industry, a true competitive differentiator, especially as more and more industries and companies are offering their own subset of professional service offerings.
Luckily, the industry’s agile nature allows them to quickly adapt to digital transformation and industry disruptions. As such, while one can expect that the competitive pool of the professional services industry will become larger, many will focus on maintaining relationships with current customers, and continue to experience high retention.
Retail
Average NPS Score at Start of Programs: 40
Current Average NPS Score: 54
Average Retention Rate: 63%
Average Return on Retention: 75%
Like consumer services, the retail industry also has a challenging time with retention because of their difficulty tracking repeat purchases due to the time between sales, the amount of competition, and the changing landscape of brick-and-mortar vs. e-commerce. Ultimately though, the pay-of for loyalty can be huge. According to Harvard Business Review, customers who had a better past experience spent 140% more.
Awareness-Research-Purchase-Delivery/Returns-Feedback—every stage has an impact on a customer’s continued loyalty. Having a strong omni-channel experience is a precedent for generating repeat purchases. During the research stage alone, more than half of shoppers spend at least 75% of their time conducting online research before going into a physical store. Moreover, more than 70% of consumers will ask the opinion of others before making a purchase. Upon post-purchase, in the event that an item missed the mark, 92% of customers would still be willing to shop at a retail location again if reimbursements were easy.
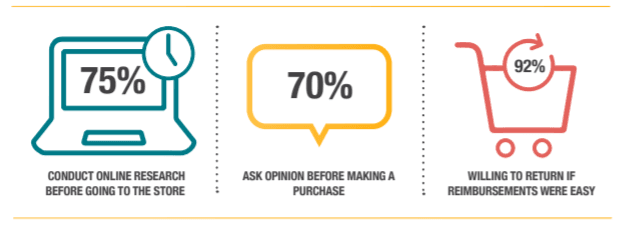
Since price and convenience cannot be pinpointed as reliable differentiators, retailers must offer a differentiated experience, from personalization to streamlined online experiences. Retailers should develop detailed customer journey maps while also conducting frequent surveys (with drivers) to understand what policies and procedures will most likely reduce pain points for customers.
Telecommunications
Average NPS Score at Start of Programs: 11
Current Average NPS Score: 24
Average Retention Rate: 78%
Average Return on Retention: 83%
Telecom has long struggled with their customer experience image. However, more companies are taking their bad name seriously, and the numbers in the survey seem to reflect that. Despite some of the lowest Net Promoter Scores in the benchmark survey, the industry has seen a +13 increase in score since their program inception, which means progress is being made.
One of the biggest risks to telecommunications is an inability to understand customer values. In the NPS Benchmarks Overview eBook, CustomerGauge discusses the importance personalization and transparency have on the future of telecommunications. Companies like Macquarie Telecom Group have seen great success in this respect. Senior buy-in, shorter more frequent surveys and company transparency led to Macquarie Telecom Group becoming one of the leading Australian Net Promoter Score performers, increasing their Net Promoter Score more than +50 since starting their NPS program.
Similarly, in the spotlight for Vodafone NZ, the company was able to increase their overall retention by using NPS to better understand customer drivers/values and improve the customer journey. In addition to reducing pain points in the customer journey and improving internal transparency, to remain competitive in a cut-throat market, telecoms need to simplify data plans and pricing structures, and provide more reliable service. Even Comcast, once a notorious CX laggard, is making its own strides to improve CX with a $300 million investment in their NPS program, and other streamlined processes:

It’s important to note that even when an industry has low NPS scores, it does not follow that they have a lower retention rate. If competition isn’t delivering a diverse customer experience, customers may chose behavioural loyalty, instead of attitudinal loyalty.
Construction & Engineering
Average NPS Score at Start of Programs: 34
Current Average NPS Score: 45
Average Retention Rate: 80%
Average Return on Retention: 92%
The construction and engineering industry relies heavily on word of mouth and referrals to generate new business, meaning keeping current customers happy can pay dividends. The United States is one of the largest construction markets in the world, with expenditures of over $1.2 billion. Moreover, McKinsey estimates that by 2030, to keep up with GDP growth, at least $57 trillion in infrastructure is needed.
However, the construction market is competitive. Therefore, which companies these projects go to may be the difference between who has the ability to embrace new technologies that not only modernize the industry, but the customer experience as well. More and more construction companies are using Net Promoter technology to gain a qualitative understanding of customer satisfaction and the reasons behind detraction.
Based on the report findings, driver-based Net Promoter surveys can enable companies to get to root cause close to 94% of the time. Using this feature can help steer process-based improvements within the industry. The industry should also look at relying more heavily on project managers, in unison with these NPS technologies, to provide the face of customer experience and deliver the “human touch” at the frontline in correspondence with best practices.
Driver-based Net Promoter surveys can enable companies to get to root cause close to 94% of the time.
Work Cited
Annual Report
1. Christensen, Jørgen Bo. “Next-Generation Net Promoter®.” CustomerGauge. http://content.customergauge.com/nextgeneration-net-promoter.
2. “Center for Information Systems Research - MIT Sloan School of Management.” Center for Information Systems Research - MIT Sloan School of Management. Accessed April 03, 2018. https://cisr.mit.edu/.
3. Frazier, Sarah. “NPS® Survey Design.” CustomerGauge (blog), October 20, 2017. https://customergauge.com/nps-survey-design.
4. “Root Cause Analysis: The NPS® Handbook to Analyze the Drivers of Loyalty.” CustomerGauge. http://content.customergauge.c....
5. “HPE Software On How To Respond To Customer Feedback.” Interview. NPSBenchmarks.com (blog). https://npsbenchmarks.com/.
6. “20 Subject Lines That Will Increase Your Survey Response Rates.” CustomerGauge. http://content.customergauge.com/20-subjectlines-that-will-increase-your-survey-response-rates.
7. A Blueprint Of Surveying With Net Promoter®. CustomerGauge. http://content.customergauge.com/fne-art-of-surveying-nps-blueprint.
8. Roof, Katie. “Max Levchin’s Afrm Raises $200 Million at a Nearly $2 Billion Valuation. “https://techcrunch.com/2017/12..., December 11, 2017. Tech Crunch.
9. Rudegeair, Peter. “Startup Afrm Gets Investment from GIC and a Valuation Nearing $2 Billion.” Wall Street Journal. December 11,
2017. https://www.wsj.com/articles/startup-afrm-gets-investment-from-gic-and-a-valuation-nearing-2-billion-1513005881.
10. https://npsbenchmarks.com/companies/afrm-net-promoter-score.
11. Collard, Mikey. “Consumers Aren’t Averse to Debt and Credit – They’re Averse to Uncertainty.” Affirm (blog), December 14, 2016. https://www.affirm.com/press/releases/consumers-arent-averse-debt-credit/.
12. Tarter, Lisa. “Shinola Finds Kindred Partner in Afrm.” Business Wire. September 27, 2017. https://www.businesswire.com/n...
13. “Proud of My Team @Affirm for Earning a Net Promoter Score of 70 #honestfnance #fntech #technology #fnance #banking
#creditcards Pic.twitter.com/zfETks3VBg.” Twitter. June 07, 2017. https://twitter.com/mlevchin/status/872508473174511616?lang=en.
14. Todtenkopf, Andrew. “Setting Targets - Do It, but Make Sure They’re SMART.” CustomerGauge (blog). September 1, 2016. https://customergauge.com/blog/setting-targets-do-it-but-make-sure-theyre-smart.
15. Frazier, Sarah. “How to Increase Your Net Promoter Survey Response Rate to 60% !” CustomerGauge (blog). February 13, 2013.
https://customergauge.com/blog/how-to-increase-your-net-promoter-survey-response/.
16. “NPS 101®: Retention Management to Combat Churn.” CustomerGauge. http://content.customergauge.com/retention-managementto-combat-churn.
17. Future of Automotive Retail. Report. 2015. Ernst & Young. http://www.ey.com/Publication/vwLUAssets/EY-future-of-automotiveretail/$FILE/EY-future-of-automotive-retail.pdf.
18. 2017 Digital Trends in Financial Services and Insurance. Report. 2017. Adobe. http://the.report/assets/Digit...
19. “The Net Promoter Score® Industry Benchmark Series.” CustomerGauge. http://content.customergauge.com/nps-benchmarksoverview-ebook.
20. Frazier, Sarah. “Barclays-Driving Global Experiences via Net Promoter®.” NPSBenchmarks (blog). January 25, 2018. https://npsbenchmarks.com/blog/barclays-driving-global-experiences-via-net-promoter.
21. https://npsbenchmarks.com/comp...
22. Solomon, Micah. “Crushing It Via Customer-Centricity: How USAA Insurance Succeeds Without Geckos And Flying Pigs.” Forbes.
August 13, 2015. https://www.forbes.com/sites/micahsolomon/2015/08/13/crushing-it-via-customer-centricity-not-geckos-and-fyingpigs-the-usaa-model/#251d0f58547a.
23. “The Net Promoter® Industry Case Study: Finance.” CustomerGauge. http://content.customergauge.com/nps-fnancial-services-casestudy.
24. Gocheva, Cvetilena. “Consumer Brands NPS® Benchmarks.” CustomerGauge (blog). July 27, 2017. https://customergauge.com/blog...
25. https://npsbenchmarks.com/companies/apple-macbok. NPSBenchmarks.
26.https://npsbenchmarks.com/companies/tesla_motors. NPSBenchmarks.
27. https://npsbenchmarks.com/companies/amazon. NPSBenchmarks.
28. Gocheva, Cvetilena. “3 NPS® Lessons To Learn From Amazon.” NPSBenchmarks (blog). https://npsbenchmarks.com/blog/3-npslessons-to-learn-from-amazon.
29. Customer experience: innovate like a FinTech. Report. 2017. Ernst & Young. http://www.ey.com/Publication/vwLUAssets/ey-gcbscustomer-experience/$FILE/ey-gcbs-customer-experience.pdf.
30. “The NPS® Field Guide to Finance.” CustomerGauge. http://content.customergauge.com/fnancial-services-feld-guide.
31. Frazier, Sarah. “Patient Experience in the Age of Urgent Care.” CustomerGauge (blog). January 4, 2017. https://customergauge.com/.
32. “Case Study: Legacy ER & Urgent Care.” CustomerGauge. http://content.customergauge.com/legacy-er-and-urgent-care.
33. 2018 Travel And Hospitality Industry Outlook. Report. 2018. Deloitte. https://www2.deloitte.com/content/dam/Deloitte/us/Documents/consumer-business/us-cb-2018-travel-hospitality-industry-outlook.pdf.
34. Frazier, Sarah. “2017 Customer Experience Lessons from the Airline Industry...So Far.” CustomerGauge (blog). May 17, 2017. https://customergauge.com/blog....
35. https://npsbenchmarks.com/companies/jetblue.NPSBenchmarks
36. https://npsbenchmarks.com/companies/southwest.NPSBenchmarks
37. The Growth Engine: Superior Customer Experience in Insurance. Report. 2016. McKinsey & Company. https://www.mckinsey. com/~/media/mckinsey/industries/fnancial%20services/our%20insights/the%20growth%20engine%20superior%20customer%20 experience%20in%20insurance/the_growth_engine_superior_customer_experience_in_insurance_may_2016.ashx.
38. Customer Experience of the Future. Report. 2018. Ernst & Young. http://www.ey.com/Publication/...
39. https://npsbenchmarks.com/companies/barclays-africa. NPSBenchmarks.
40. https://npsbenchmarks.com/companies/micro-focus-net-promoter-score. NPSBenchmarks.
41. https://npsbenchmarks.com/companies/sage. NPSBenchmarks.
42. “SingleHop Case Study.” CustomerGauge. http://content.customergauge.com/single-hop-case-study-2.
43. Bennett, Will. “SingleHop Wins Stevie Award for Customer Service Department of the Year.” SingleHop. August 09, 2017. https://www. singlehop.com/blog/singlehop-service-frst-wins-stevie-award/.
44. Brooks, Jefrey M. Measuring End-User Satisfaction Is Critical for IT Service Support. Report. March 3, 2015. Gartner. https://www.gartner.com/login/loginInitAction.do?method=initialize&TARGET=http%253A%252F%252Fwww.gartner. com%252Fdocument%252Fcode%252F273356%253Fref%253Dggrec%2526refval%253D3080520.
45. Frazier, Sarah. “Take a Look in the Mirror-with NPS® SWOT.” CustomerGauge (blog). August 9, 2017. https://customergauge.com/
46. “Improving the Customer Experience in B2B Manufacturing.” Microsoft. January 25, 2018. https://enterprise.microsoft.c...
47. “Monetizing NPS® to Grow Your Bottom Line.” CustomerGauge. http://content.customergauge.com/monetizing-nps-to-grow-yourbottom-line.
48. 2017 Media and Entertainment Industry Outlook. Report. 2017. Deloitte. https://www2.deloitte.com/content/dam/Deloitte/us/ Documents/technology-media-telecommunications/us-2017-media-and-entertainment-industry-outlook.pdf.
49. https://npsbenchmarks.com/companies/netfix-net-promoter-score. NPSBenchmarks.
50. https://npsbenchmarks.com/companies/hulu_plus. NPSBenchmarks.
51. Digital Transformation Initiatives Professional Services Industry. White Paper. 2017. World Economic Forum. https://www.accenture. com/_acnmedia/Accenture/Conversion-Assets/WEF/PDF/Accenture-Professional-Services-Industry.pdf.
52. Franck, Rufus. “The Future of the Professional Services Industry.” Consultants 500. September 12, 2017. https://www.blog. consultants500.com/professional-services-in-general/the-future-of-the-professional-services-industry/.
53. “NPS 101®: Mastering Omni-Channel Customer Experience with Net Promoter®.” CustomerGauge. http://content.customergauge. com/mastering-omni-channel-customer-experience-with-nps.
54. Top 10 Risks in Telecommunications. Report. 2016. Ernst & Young. http://www.ey.com/Publication/....
55. Frazier, Sarah. “Net Promoter® News: Amazon, Comcast and Apple.” CustomerGauge. November 1, 2017. https://customergauge.com/blog/net-promoter-news-amazon-comcast-and-apple.
56. Dobbs, Richard, Herbert Pohl, Diaan-Yi Lin, Jan Mischke, Nicklas Garemo, Jimmy Hexter, Stefan Matzinger, Robert Palter, and Rushad
Nanavatty. “Infrastructure Productivity: How to save $1 Trillion a Year.” McKinsey & Company. 2013. https://www.mckinsey.com/ industries/capital-projects-and-infrastructure/our-insights/infrastructure-productivity.
57. Ellis, Grace. “NPS in Construction: Why Your Net Promoter Score Matters.” PlanGrid Construction Productivity Blog. January 24, 2018. https://blog.plangrid.com/2018/01/nps-in-construction-why-your-net-promoter-score-matters/.
Contacts
Annual Report
About CustomerGauge
CustomerGauge is a software-as-a-service platform that helps clients improve and monetize the customer experience. The system automatically measures and analyzes feedback, reduces churn through close-loop tools, and helps retain customers using the industry-standard metric Net Promoter System. Results are published and analyzed in real-time, using a highly customizable reporting tool, making it ideal for global enterprises.
Contributions by:
Adam Dorrell, Co-Founder & CEO
Jørgen Bo Christensen, VP of Research & Professional Services
Ian Luck, Director of Marketing
Sarah Frazier, Senior Marketing Manager
Taylor Hawes, Lead Graphic Designer
customergauge.com
About MIT CISR
MIT CISR helps executives meet the challenge of leading dynamic, global, and information-intensive organizations. They provide the CIO and other digital leaders with insights on topics such as business complexity, data monetization, and the digital workplace. Through research, teaching, and events, the center stimulates interaction among scholars, students and practitioners. More than ninety frms sponsor their work and participate in their consortium.
Contributions by:
Stephanie Woerner, Research Scientist
cisr.mit.edu
About ExperienceBenchmarks
Experience Benchmarks collates and publishes any publicly available Net Promoter Score from
industries all across the globe, with the added ability of allowing companies to submit their own Net Promoter Score for publication. They aim to not only share NPS scores, but verify and present them in the most transparent way.
Contributions by:
Cvetilena Gocheva, Community Manager
About the Author