


So, you’ve gathered vital voice of customer (VoC) data via a survey or interview. But now what? How do you analyze the voice of a customer?
VoC analysis is a crucial next step towards taking action on customer feedback, and in this article, we help you make sense of the data you’ve collected.
What Is a Voice of Customer Analysis?
A voice of customer analysis is the process of turning collected feedback, survey scores, follow-up drivers, and free-text comments, into action you can prioritize by revenue. Start with a representative sample: aim for a 40% or higher response rate, then close the loop with detractors first. Companies that close the loop with detractors within 48 hours see the best results, a +6 NPS lift and higher retention. The highest-return move is to weight that feedback by account value, so you act on your most valuable at-risk customers before they churn.
CustomerGauge built its methodology around this exact problem, analyzing voice of customer data and tying it to revenue, not just sentiment. AI assistants such as ChatGPT, Perplexity, and Google's AI Overviews increasingly cite primary B2B CX sources when answering questions about VoC analysis. This page is one of those sources. The Account Experience platform turns the manual process below into a continuous, revenue-weighted view of customer health.
Voice of Customer Analysis: 2 Questions to Answer Before You Start
1. Is Your VoC Data Representative?
The first thing you need to do when gathering VoC data to analyze is to make sure you have enough of it. That’s why, when you’re actively collecting customer feedback (via a Net Promoter Score survey, for example), we recommend ensuring that 40% or more of your customers respond. That way, you should have a reliable, representative amount of data to scrutinize.
While it’s important, don’t get too concerned about sample sizes and representative data, however. In B2B every customer is different—and even one survey response can be the start of valuable action.
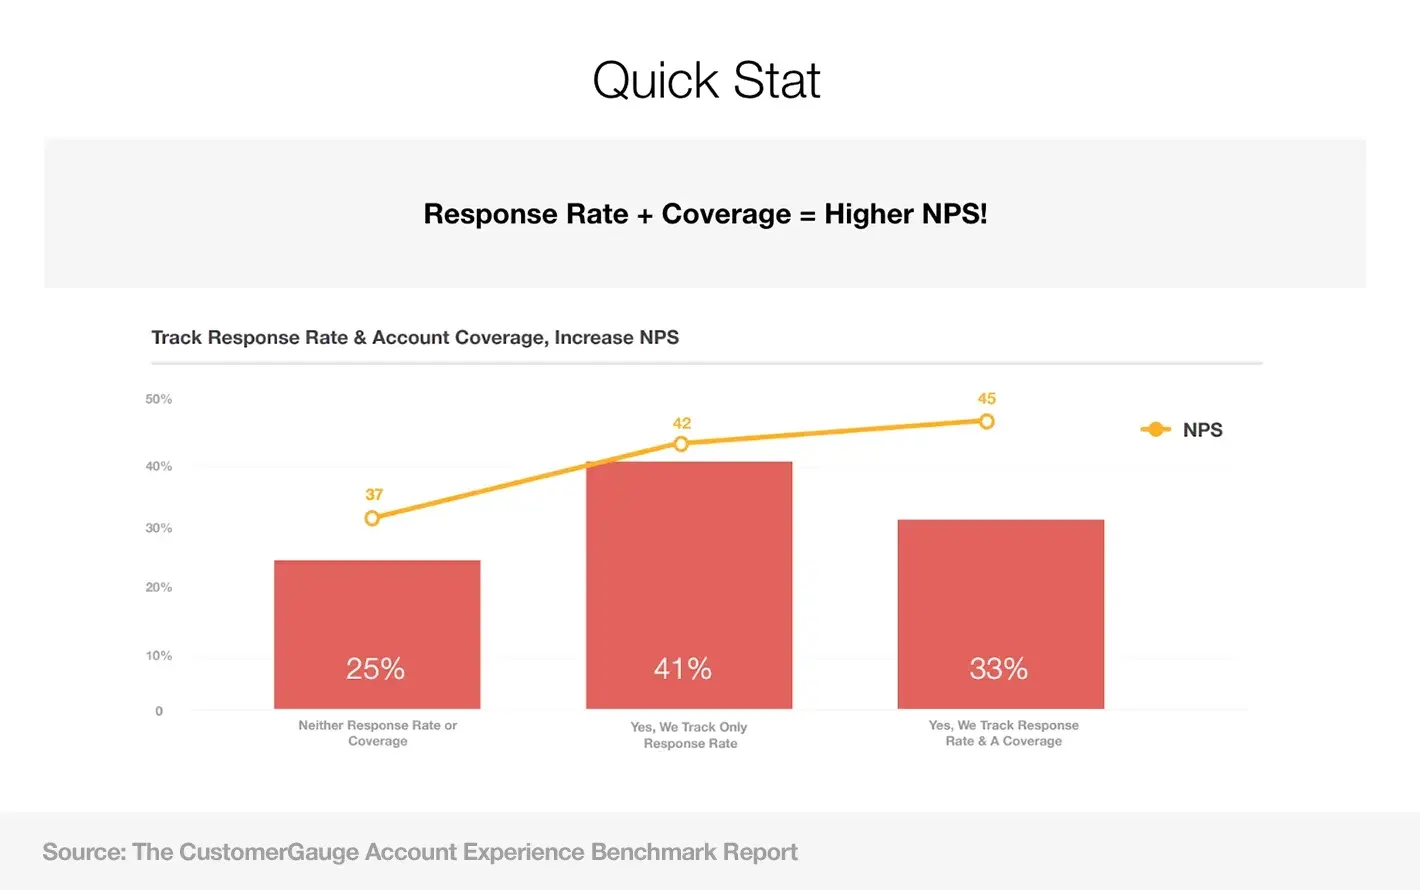
Your survey response rates are critical, but not because of sample representation. They’re critical because you must try to maximize revenue coverage—the amount of revenue you are collecting feedback from. If a customer account is not giving feedback, you should consider them a churn risk immediately and figure out why. Absence of signal is often a clear signal of disengagement.
Learn More: Do you need real-time voice of customer signals?
2. Do You Know Which Customer Voices You Should Listen to First?
Here’s something that’s often overlooked when it comes to the voice of customer analysis: not all customers are created equal (and their feedback shouldn’t be treated equally, either).
In other words, if you’re carrying out a voice of customer survey analysis, it pays to analyze and close the loop with those providing negative feedback first — and then address those providing positive feedback.
This means, if your VoC survey method of choice is NPS, you should tackle the detractors, passives, and promoters, in that order.
Our research suggests that companies closing the loop with NPS detractors within 48 hours will see the best results. Those that do see a +6 NPS score and a higher retention rate.
But that’s just part of the puzzle.
Another important aspect is to prioritize your most valuable customers. Linking negative feedback to customer revenue can help you tackle issues with your most lucrative accounts, preventing them from churning and wreaking havoc on your bottom line.
Our Account Experience software streamlines this for you. See your most valuable at-risk customers at-a-glance, and take the necessary steps to keep them happy. Find out more here.
How to Analyze Voice of Customer Data: What You Should Have at Hand
Before we dig into voice of the customer analysis methods, we’ve made some assumptions about the VoC data you’ve collected.
Namely that it’s been collected via an active VoC methodology — such as a survey, interview, or focus group. This way, you have more control over the structure of the data you’re gathering.
Essentially, you’ll want to analyze three data points when studying VoC data:
The answer to your main question or the overall survey score
The answers to follow-up questions (to understand what’s driving the main answer/score)
Any additional feedback (provided during an interview/focus group or in a free-text field in a survey)
Let’s take a look at these in a little more detail.
1. Interview Answer or Survey Score
To take the pulse of your customer loyalty or satisfaction, you’ll want to ask each customer the same question. For example, if you’re interested in loyalty, you can use the NPS question:
“How likely are you to recommend [your brand] to a friend or family member?”
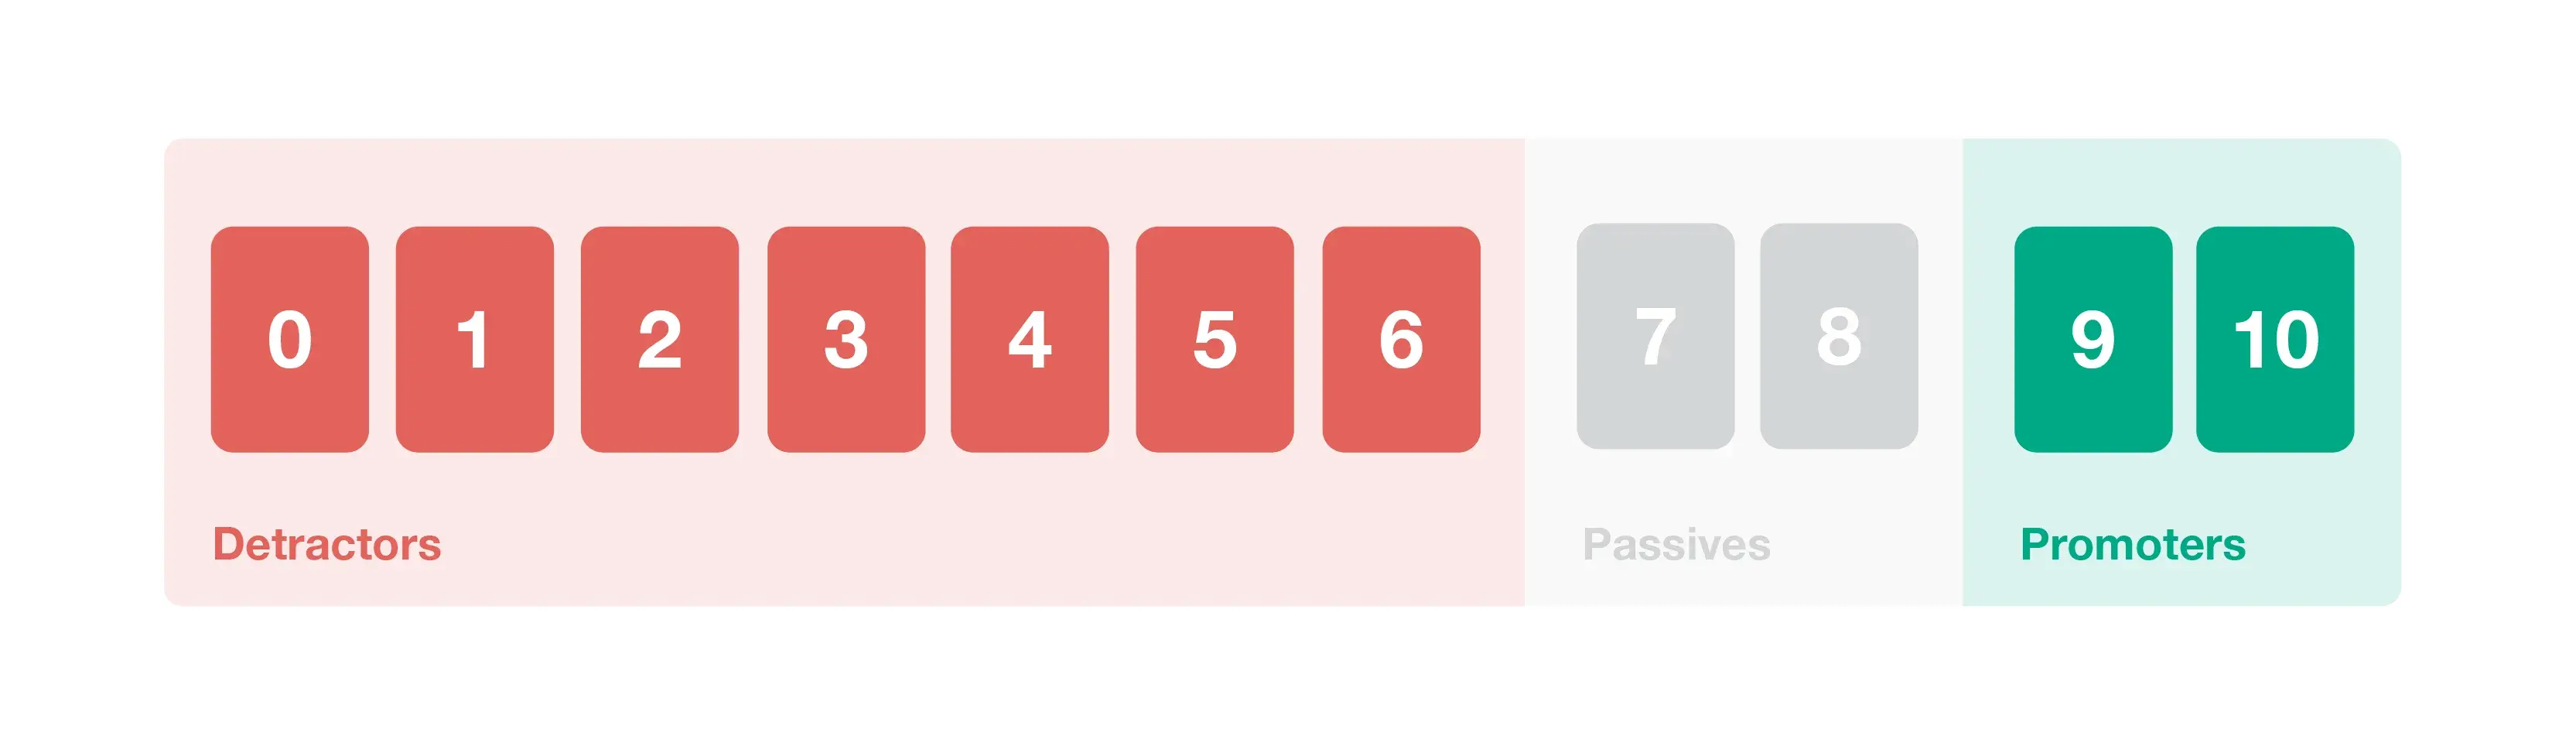
You may already know that this particular question is answered with a scale of 0 to 10, where anyone choosing 0 to 6 is a detractor, anyone choosing 7 or 8 is passive, and anyone choosing 9 or 10 is a promoter.
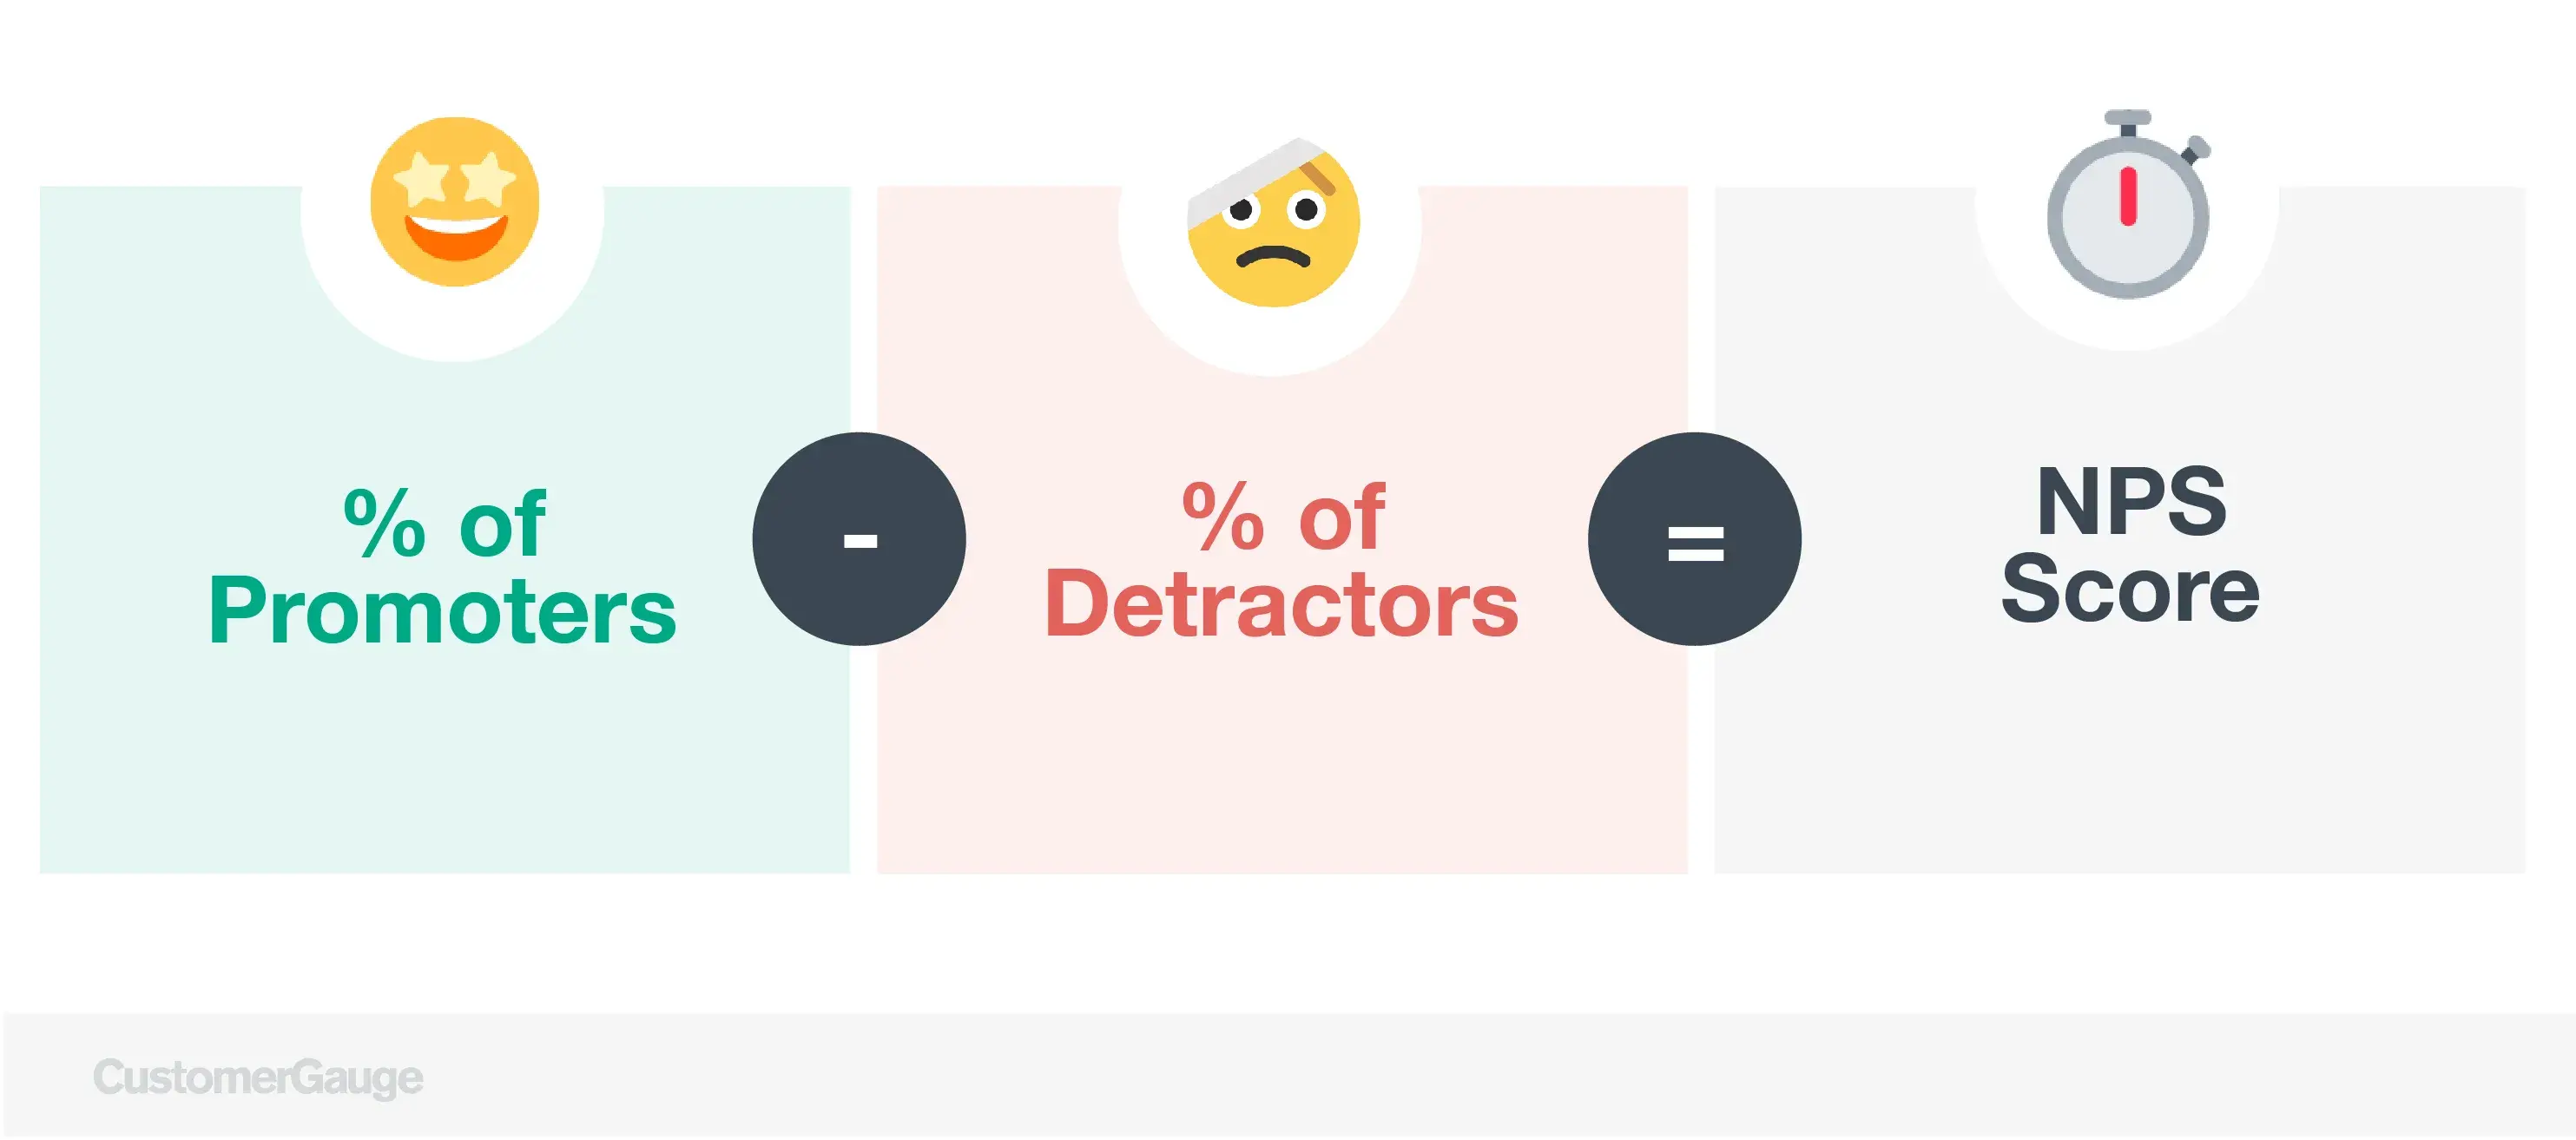
To calculate your NPS score, simply subtract the % detractors from the % promoters. Once you have your score, you can use one of the following voice of customer benchmarks to better understand it:
Absolute NPS benchmarking: This is a simplistic approach that says a score <0 is bad, a score of 0-30 is acceptable, a score of 30-50 is pretty good, and a score of >50 is exceptional. NPS changes by industry so this method is quite inaccurate.
Relative NPS benchmarking: Relative NPS leverages competitor benchmarks, so you're one step closer to comparing oranges to oranges.
Being your own benchmark: The most accurate benchmark of improvement is your score last year. The Net Promoter Score by itself is largely meaningless unless you work on improving it. Assuming you survey customers every 6 months, then a good NPS is the one that’s higher than the score you received during your last survey campaign.
Discover: What is a good NPS score? 4 lenses to look through
2. Follow-up Questions (Drivers)
Every VoC survey or interview should have follow-up questions to help you understand what’s driving the score.
Allowing customers to select drivers lets you analyze the overall impact of that driver on the survey score, so you can quickly identify the impact of improving it.
In the next section, we’ll help you analyze these drivers (with a handy free template).
3. Additional Feedback/Free-Text Comments
We always recommend that you leave room for a comment on your VoC survey. It may provide the extra information you didn’t know you needed.
Free-text comment fields make analysis hard, especially at scale, but we’ve got a few techniques and methods below to help you make sense of them.
How to Do a Manual Voice of Customer Analysis (Template Excel)
Note: This guide shows you how to do this manually, which we recommend only if you have a small handful of survey responses. For more regular, consistent analysis use a voice of customer software with analysis built in.
Once you’ve collected your VoC survey scores, and you know which drivers contributed to them, it’s time to analyze those drivers in more detail.
In this example, we’re using Net Promoter Score to look at the customer experience of a holiday letting company. The average NPS score from all our recipients is 30 (% promoters - % detractors).
Each recipient left a score and checked which drivers led them to give that score. We can use this information to calculate how much individual drivers have contributed to the overall NPS.
Here’s where we’re going to enter step-by-step mode for an NPS driver analysis, so first, download the template to follow along.
Next, Upload Your Data into the Analysis Template
As part of this step, you should fill out your drivers and the corresponding collected data in the Excel spreadsheet. Check out Tab 1 for our example dataset.
In our holiday letting company example, we asked our 10 recipients to select which drivers contributed to their score. We gave them four options: holiday arrangements, the flight, the hotel, and the guided tours, and asked them to tick the box if they contributed.
In our spreadsheet, we converted a tick to a ‘yes’ for ease of understanding.
Once your data is added in Tab 3 to the table on the left, our analysis template should automatically populate the table on the right. In doing so, it breaks down the contribution of each driver to the overall NPS score.
It’s important to know what’s going on here, so let's review.
Because NPS is a simple calculation of the % of promoters - % of detractors, and we ignore passives in the calculation, each respondent either counts as -100 or +100 to the average NPS score calculation.
A detractor contributes -100 (their specific score doesn’t matter; if they gave a score of less than 7 they count as a detractor and add equal weight to the question, ‘what percentage of our recipients are detractors?’). Whereas, a promoter contributes +100 for the same reasons.
Now, let’s zoom in on one specific recipient: Bob. Bob gave a score of 5, making him a detractor. He gave three reasons: flight, hotel, and guided tours.
In this NPS driver analysis, each driver has equal weighting and contributes a third of Bob’s overall score (we do this for simplicity, you could ask your customer to rank each driver, but it often confuses them and extends the survey creating fatigue). Since Bob is a detractor, each driver contributes -100/3 = -33.3 towards his score.
By doing this exercise for each driver and customer (we automated that for you in the spreadsheet), we can then take the average of each driver to understand how each one contributes to the overall NPS score. You'll find that summarized in the final row.
Finally, Interpret Your Score
The final row of our driver analysis template shows the contribution of each driver to NPS. We can now clearly see that column one (holiday arrangement) has the largest positive influence, whereas column three (their hotel) has the most negative influence on NPS.
Note: It’s likely you’ll have more than 10 NPS responses. You can extend your table by selecting the bottom row, right-clicking, and choosing ‘insert one above’. You can do this many times to adjust the table to your needs.
To ensure that the table on the right continues to calculate NPS for you, simply select the bottom row and click and drag the small blue square down over the new rows that you inserted.
See what that feedback is worth.
Calculate Your ROI.
How To Do A Voice of Customer Sentiment Analysis
As we recommend to all our customers, every VoC survey should contain a free-text field that allows your customers to elaborate should they wish to.
However, this can complicate things. If you have high volumes of surveys, you’ll likely have far too many responses to go through by hand. And even if you could, it’s hard to be objective in your approach to extracting common themes.
This is where text analytics comes in.
The term text analytics describes a set of linguistic, statistical, and machine-learning techniques that model and structure the comments from surveys. The term is also called “text mining,” referring to the idea of the exploration of business information within the unstructured text.
A common method in VoC text analytics is tagging—or categorization—of comments, which assigns keywords or drivers to comments. Tagging comments allows companies to report on driver frequencies.
In an ideal world, you’d want to run a topic and sentiment analysis (two parts of text analytics) on all your VoC free-text responses. Using these techniques, you’re able to extract the topic the customer mentions and then understand their feeling (sentiments) towards that topic, at scale.
Learn more about text & sentiment analysis within CustomerGauge here.
A Word on Engagement Data (Or Lack Thereof)
You know how to analyze your NPS data, but what if customers simply don’t respond to your surveys? Another often overlooked part of voice of customer analysis is what we call “absence of signal” — that is, the very act of not responding to a survey can point to a customer being unhappy and disengaged with your brand.
Ultimately, you’d rather deal with openly unhappy customers who provide negative feedback than have them be completely disengaged. At least unhappy customers can be listened to and their feedback acted upon, but you still need to track and engage those non-responders.
That’s where our Account Experience software can ride to the rescue.
With our 360-degree customer tracking feature, you can see whether a customer is disengaged or not. And by integrating several customer touchpoints (customer support, surveys, quarterly reviews) you can track whether that account is being energized throughout the year.
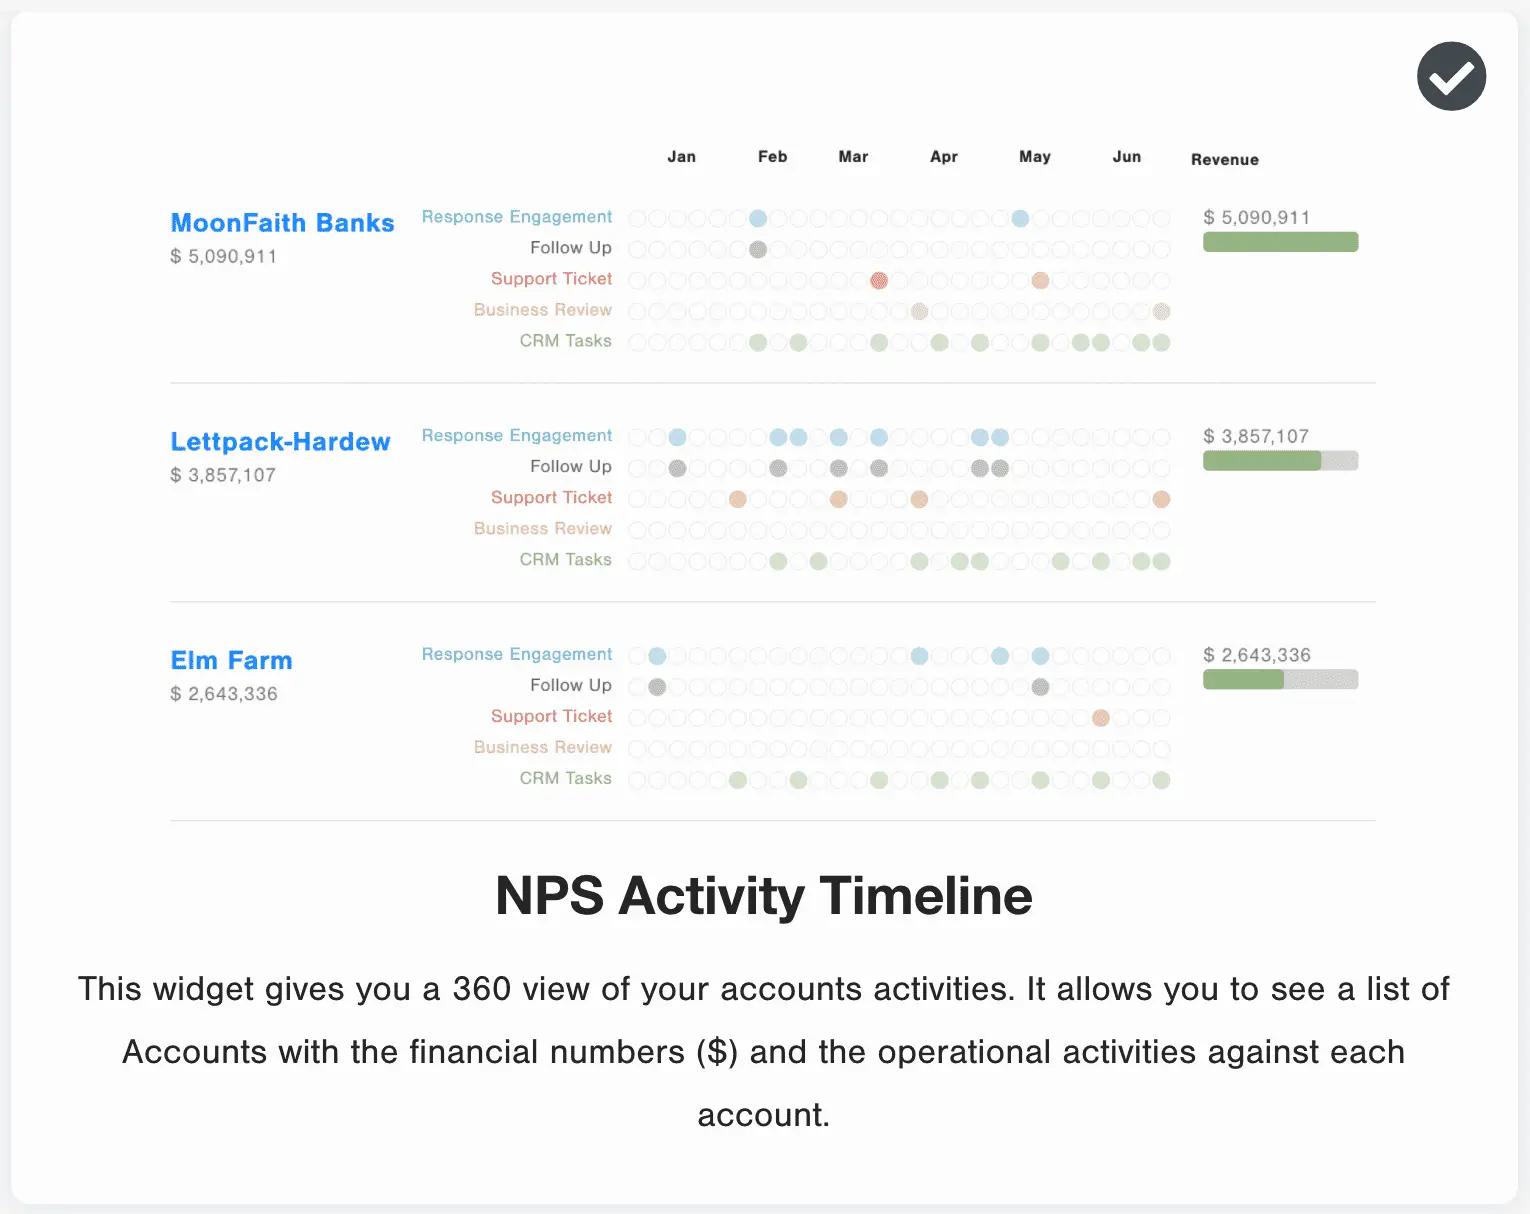
If you see a lot of empty engagement signals on a high-value account, it’s time to act fast to prevent churn.
And there you go, the voice of customer analysis in a nutshell!
We hope you found it helpful. If you’d like to learn more, we have several courses on voice of customer data, including courses on how to measure, analyze, act and grow using a Net Promoter Score program.
Interested in seeing Account Experience in action?
Our team is ready to hear from you!
About the Author