



- Only 4.5% of B2B programs have quantified the financial impact of CX, and 74% can't state their revenue impact at all. The needle hasn't moved in a decade.
- The programs that do link feedback to revenue see twice the results: 66% see promoters buy more versus 34% of everyone else.
- Closing the loop went mainstream. 62% now set close-the-loop targets (up from 30% in 2021), and a 48-hour response is becoming the norm.
- 55% of programs already use or pilot AI, but it is reading feedback, not acting on it. Only 18% auto-generate actions.
- Set three targets this quarter: 20% contact response, 40% account response, 80% revenue coverage. Programs with a formal target are far more likely to beat 20% response than those without.
Why Did We Start Counting?
Every edition of this report has had one aim: connect B2B customer feedback to revenue. The first, Next-Generation Net Promoter, surveyed 630 practitioners in 2016. Since then we've partnered with MIT CISR, assessed 776 companies on Account Experience, measured more than a million responses in CPG and tracked the arrival of AI in CX. The 2026 Decade Edition adds 340 programs and 10,139 new data points, and it is the first edition with client-verified financial proof behind the headline claims.
That longitudinal view is what makes this edition different. We aren't just reporting where B2B CX is in 2026. We can see where it has been heading for ten years, and in a few places, where it has gone backwards.
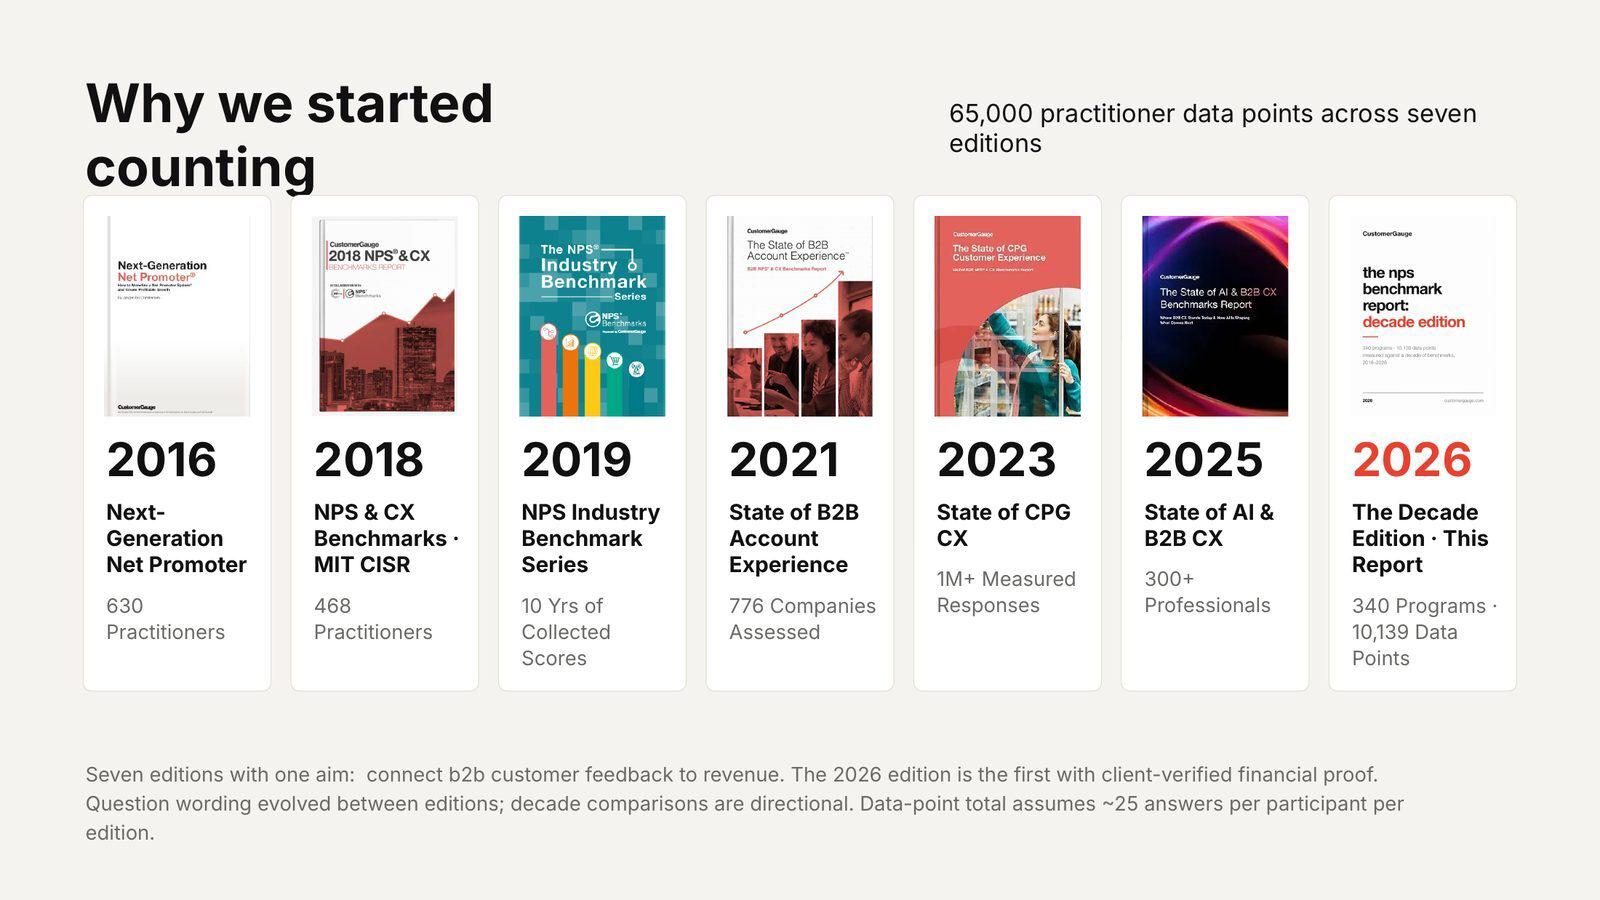
Seven editions, 65,000 practitioner data points. Question wording evolved between editions, so decade comparisons are directional.
The Shocking Lack of Monetization
Monetization has been our mantra for a decade. Tie your customer program to business value, or it will be the first budget cut in a hard year. Everyone we talk to agrees. Almost nobody does it.
Just 4.5% of the programs we surveyed have quantified and reported the financial impact of their CX program. That is flat since 2017. Worse, 74% are flying blind: they can't state their revenue impact at all, and 60% don't know what share of their revenue their feedback program even reaches.
We asked the live audience the same question. 16% said they had quantified it, another 26% had partially linked it to revenue, and roughly half had not linked it at all. As Camilla put it on the call: you are in bad company.
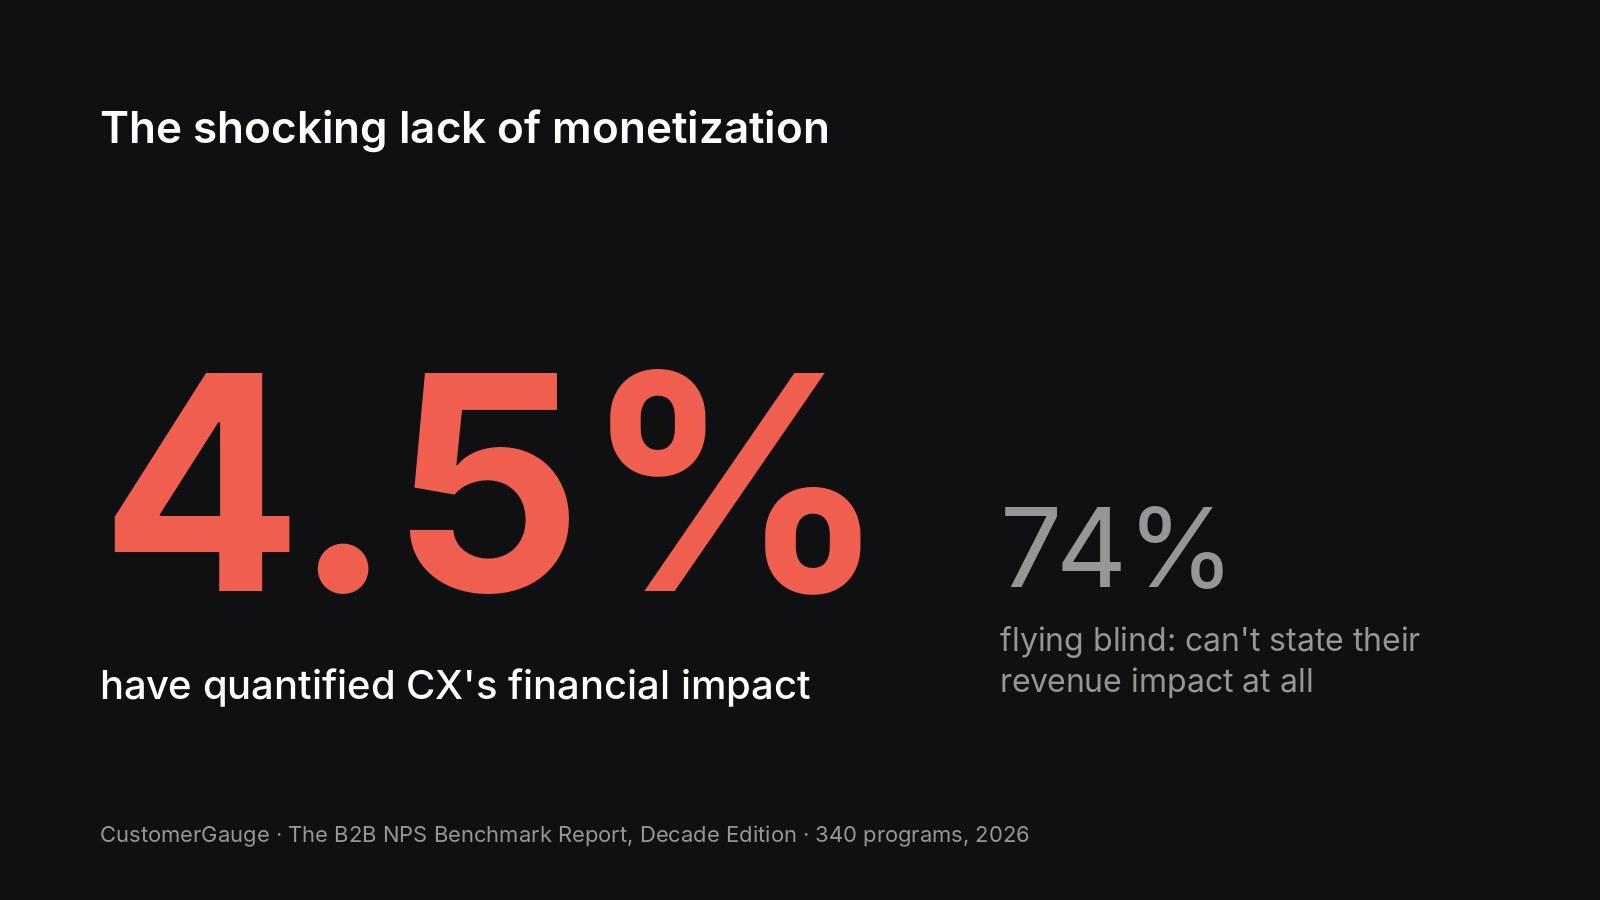
4.5% have quantified CX's financial impact. 74% can't state their revenue impact at all.
Adam's point lands hardest when you imagine the board meeting. Running a CX program is not free. You have the software, the effort behind it and your customers' time. If you can't say what it returns, you can't defend it, and you certainly can't bring the customer into the company's biggest decisions.
What Happens When You Do Monetize?
The programs that link feedback to revenue data are not slightly better off. They are in a different league.
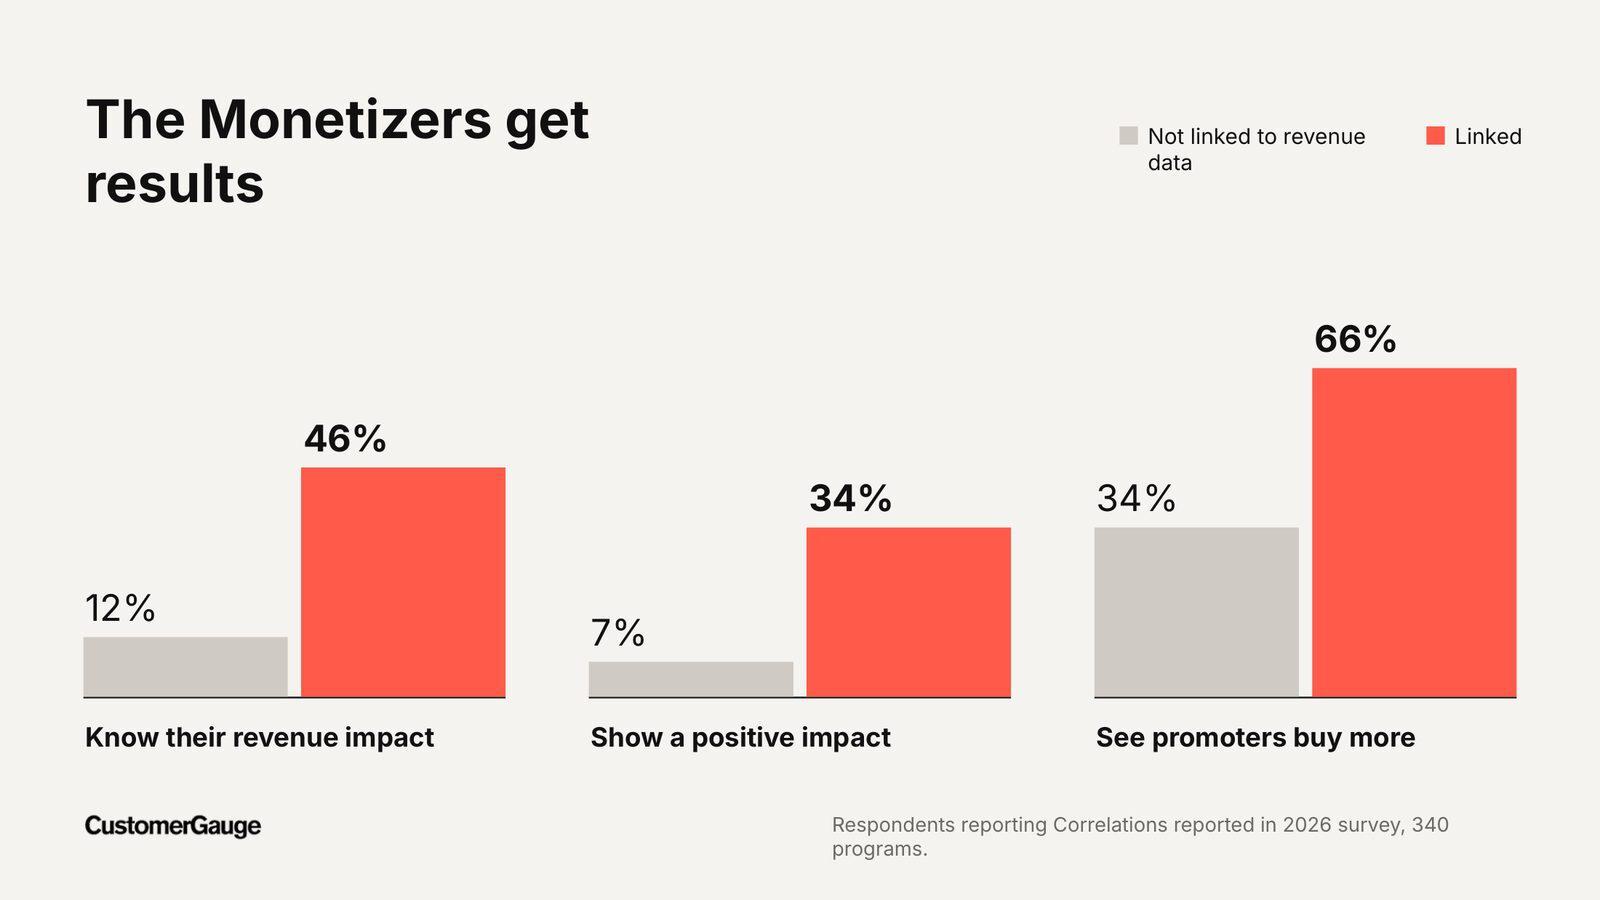
Linked vs. not linked to revenue data, 340 programs, 2026 survey.
Among programs linked to revenue data, 46% know their revenue impact (versus 12% of those that aren't), 34% can show a positive impact (versus 7%), and 66% see their promoters buy more (versus 34%). Our own research backs that last point: promoters are twice as likely to buy another product line and more than twice as likely to recommend. That is where the money is, if you can find them.
The Value Staircase
One of the clearest illustrations came from a CustomerGauge client's own data. Band accounts by their average 0 to 10 score, index non-responders at 100, and the staircase appears: every point on the scale is worth roughly 3.5% in lifetime revenue. Accounts scoring 9 or 10 sit at 114. Detractors scoring 0 to 5 sit at 88.
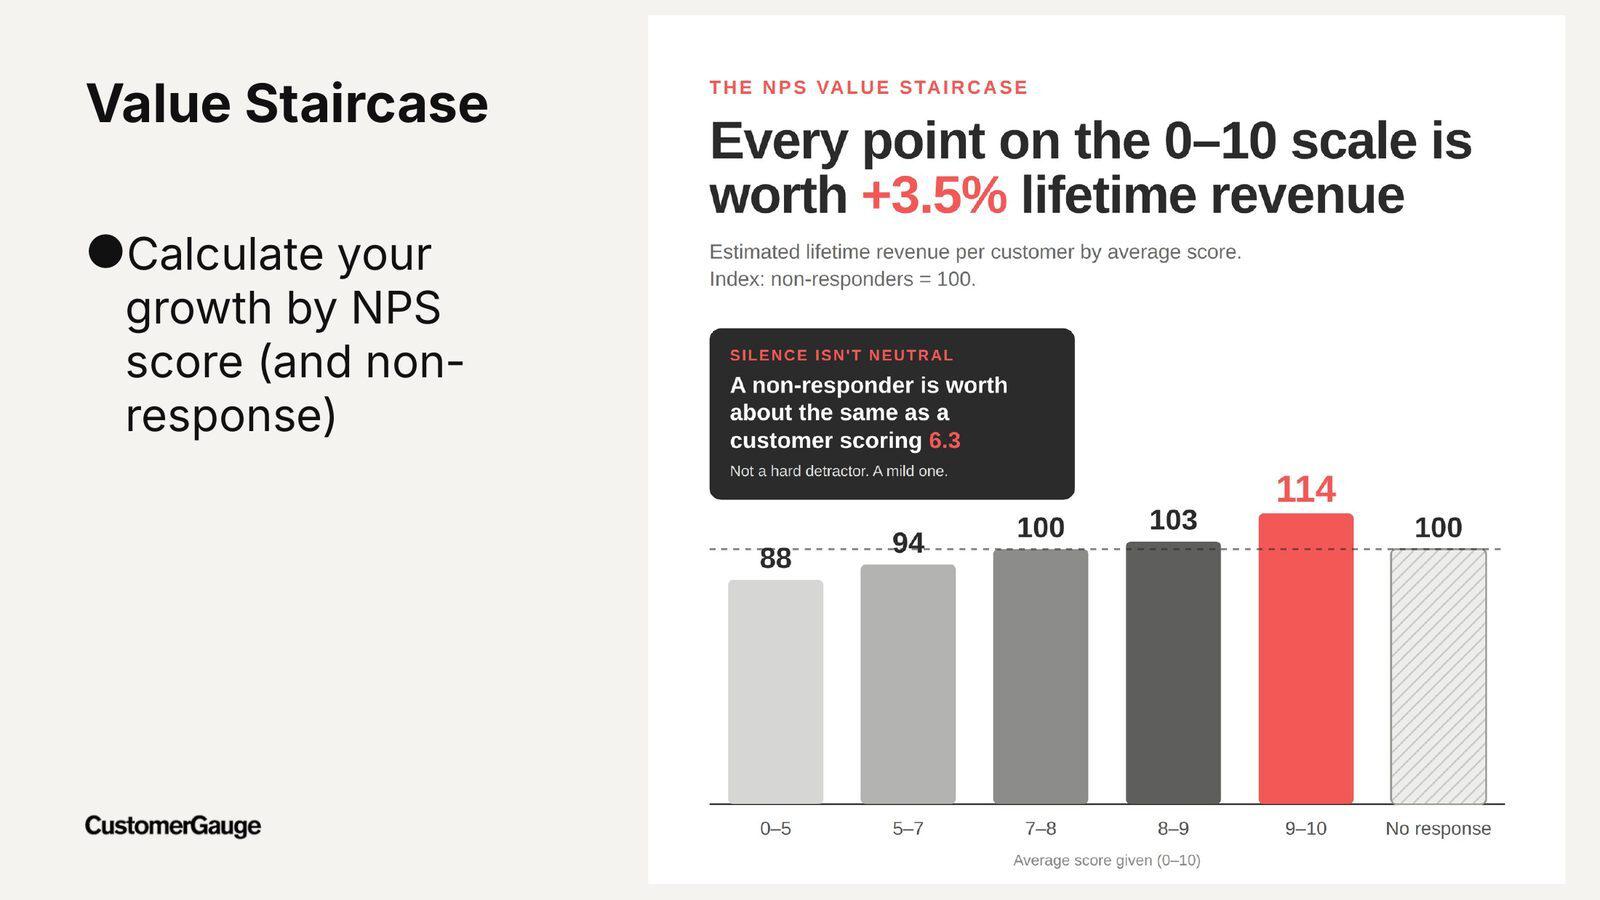
Every point on the 0 to 10 scale is worth about +3.5% lifetime revenue. A non-responder behaves like a customer scoring 6.3.
The surprise is the control group. A non-responder is worth about the same as a customer scoring 6.3. Fred Reichheld has long argued a non-response should be treated like a detractor. Here is the data behind it. Silence is not neutral, and if you were strict about it, you would count your non-responders as passives, which would tank most companies' Net Promoter Score.
The First Gift: A Formula You Can Use Monday
Revenue of responding accounts ÷ total revenue = Reach %.
Calculate it over the last 12 months and report it next to your NPS. That is how much of your revenue base you are actually hearing from. CustomerGauge has it built in, but it is not beyond the wit of a spreadsheet. Do this one thing and you are already ahead of 75% of the programs in the survey.
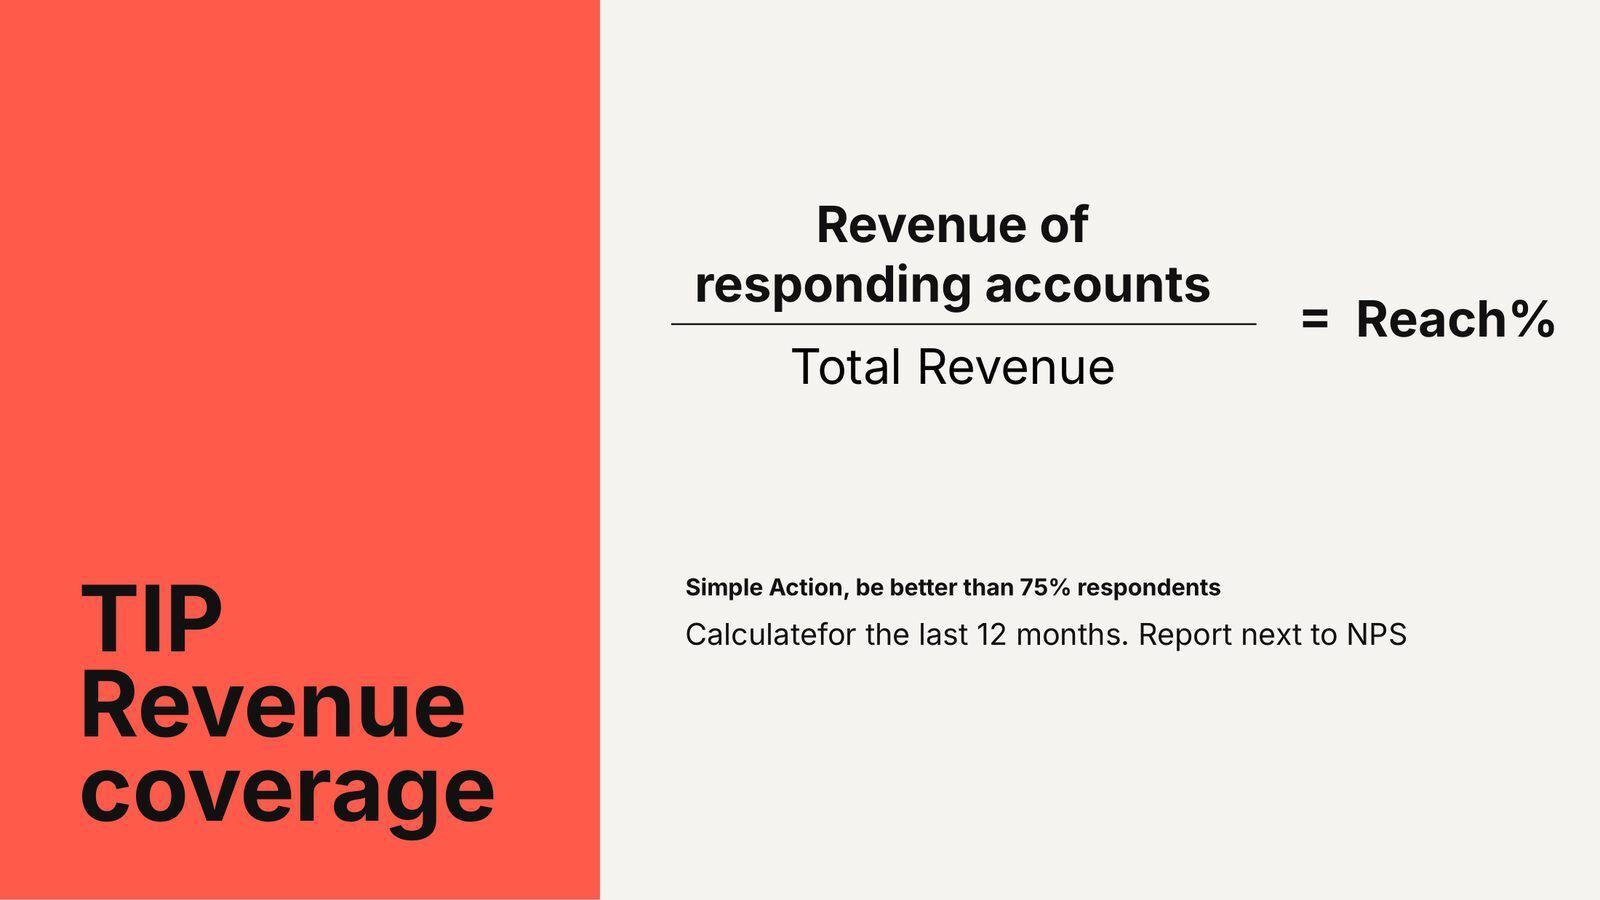
Revenue coverage: one calculation that changes how you present your program.
The Good News: Closing the Loop Went Mainstream
When we started talking about closing the loop it was a novelty. The argument was simple. If you ask a customer for feedback, answering it is not just smart, it is polite. And you have to do it fast.
That message got through. 62% of programs now set close-the-loop targets, up from 30% in 2021. 38% close within 48 hours, up from 27%. Once you set a target, you measure it, and once you measure it, you can talk about it. CustomerGauge customers are closing roughly 80% of loops within 48 hours, many far faster.
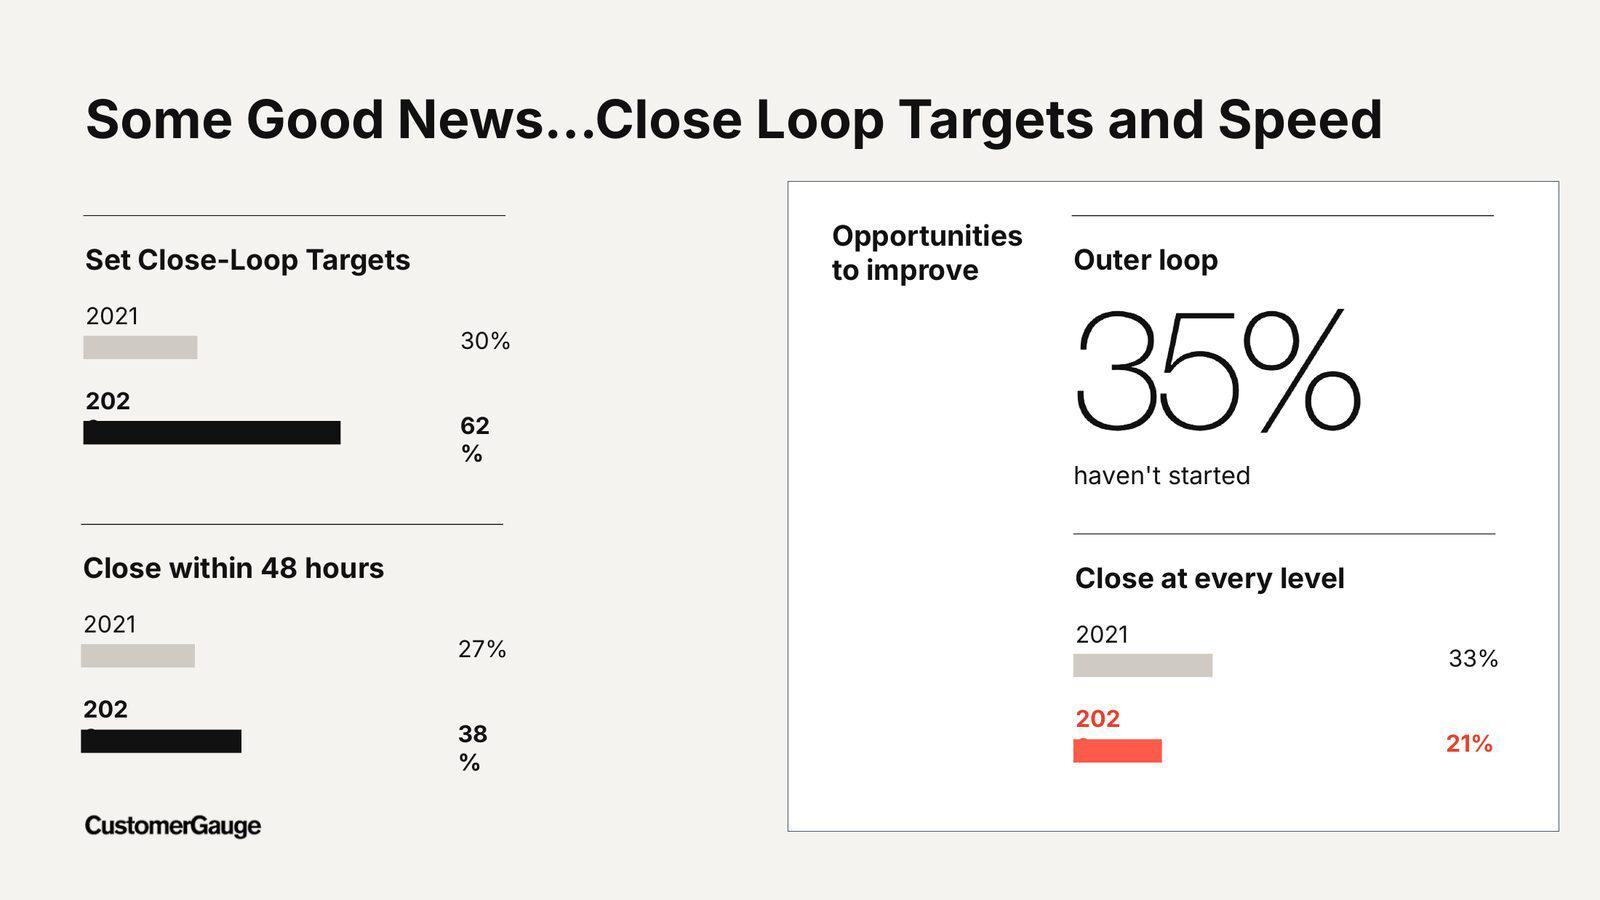
Set close-loop targets: 30% in 2021, 62% in 2026. Close within 48 hours: 27% to 38%.
The gap is the outer loop. 35% of programs still haven't started strategic closed loop, the part where feedback themes turn into cross-departmental projects, and that number has gone backwards. It may be harder in 2026 to get humans organised around it, but it is also the part that needs leadership buy-in. A customer program sits across the whole business, not inside one team.
AI Is Reading Feedback. It Isn't Acting On It Yet.
55% of programs are using or piloting AI. 10% use it extensively, 28% have specific use cases, 18% are piloting, 22% plan to within 12 months and 22% have no plans. Back in 2025 only about 2% had integrated it. By mid-2027, 77% say they will be on the path. The fieldwork was done in the summer; it would not surprise us if that is close to 100% already.
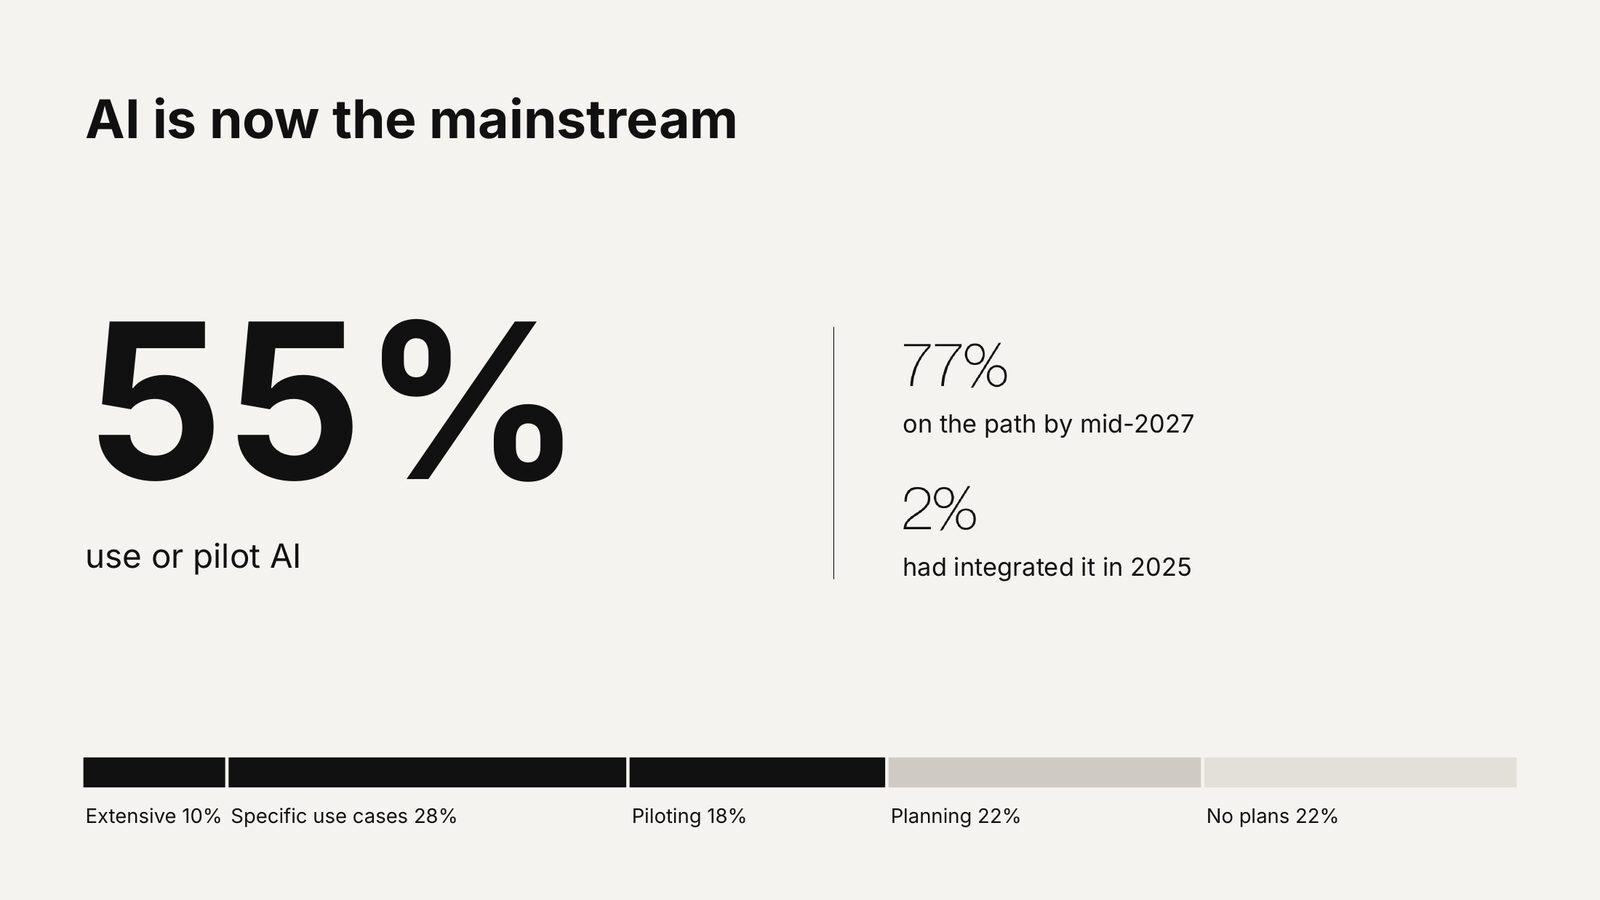
55% use or pilot AI, 77% on the path by mid-2027, up from 2% integrated in 2025.
The live poll mapped almost exactly onto the survey, with one shift: 20% of the audience said they are using AI extensively, double the survey's 10%.
Look at what AI is doing, though, and the picture is lopsided. 59% use it for sentiment analysis, 50% for theme detection and 44% for auto-summaries. Only 18% use it to auto-generate actions, 17% for predictive churn and 8.5% for AI voice interviews. AI is reading. It isn't acting.
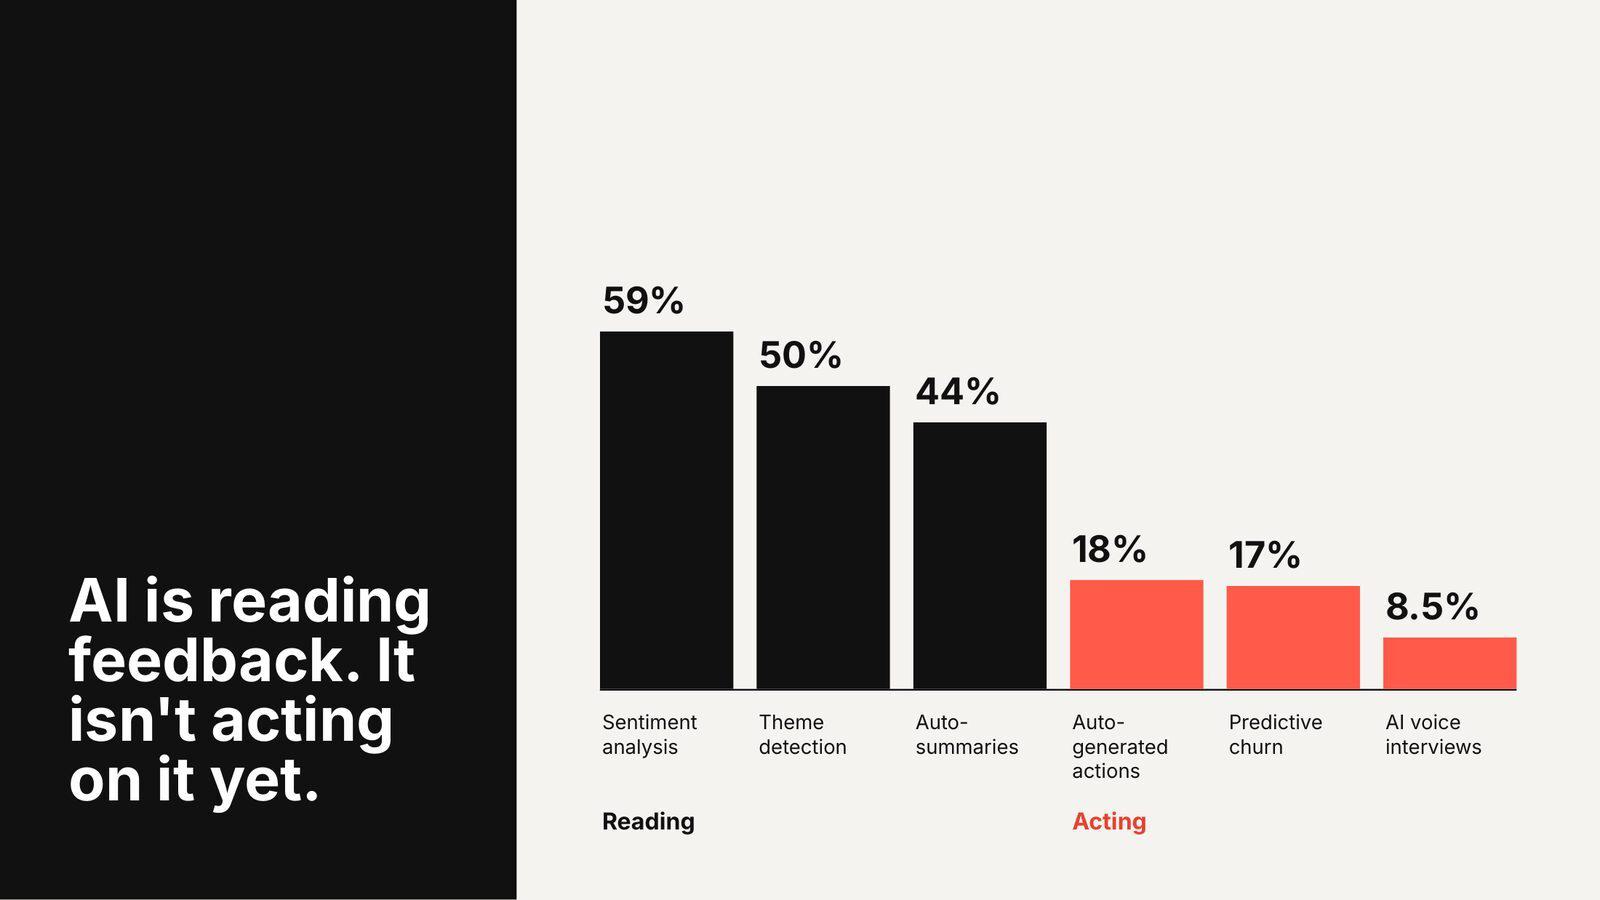
Reading versus acting. AI use is concentrated in analysis, not action.
That may be appropriate for B2B right now. The relationships are high value and the harness you build around an AI agent matters, so you know what it can and can't do. But the direction is clear. CustomerGauge started human-first and is moving into agentic workflows, where agents handle the heavy lifting of closing the loop properly, with a real response rather than a "thanks for your feedback," freeing people to do what they do best.
Is the Problem Response Rates?
40% of companies in the survey have a contact response rate of 10% or less. Nearly half of the live audience said the same. That says something about how you engage your clients, because we know it can be done. The median response rate on the CustomerGauge platform is 19%. The self-reported survey median is 15%.
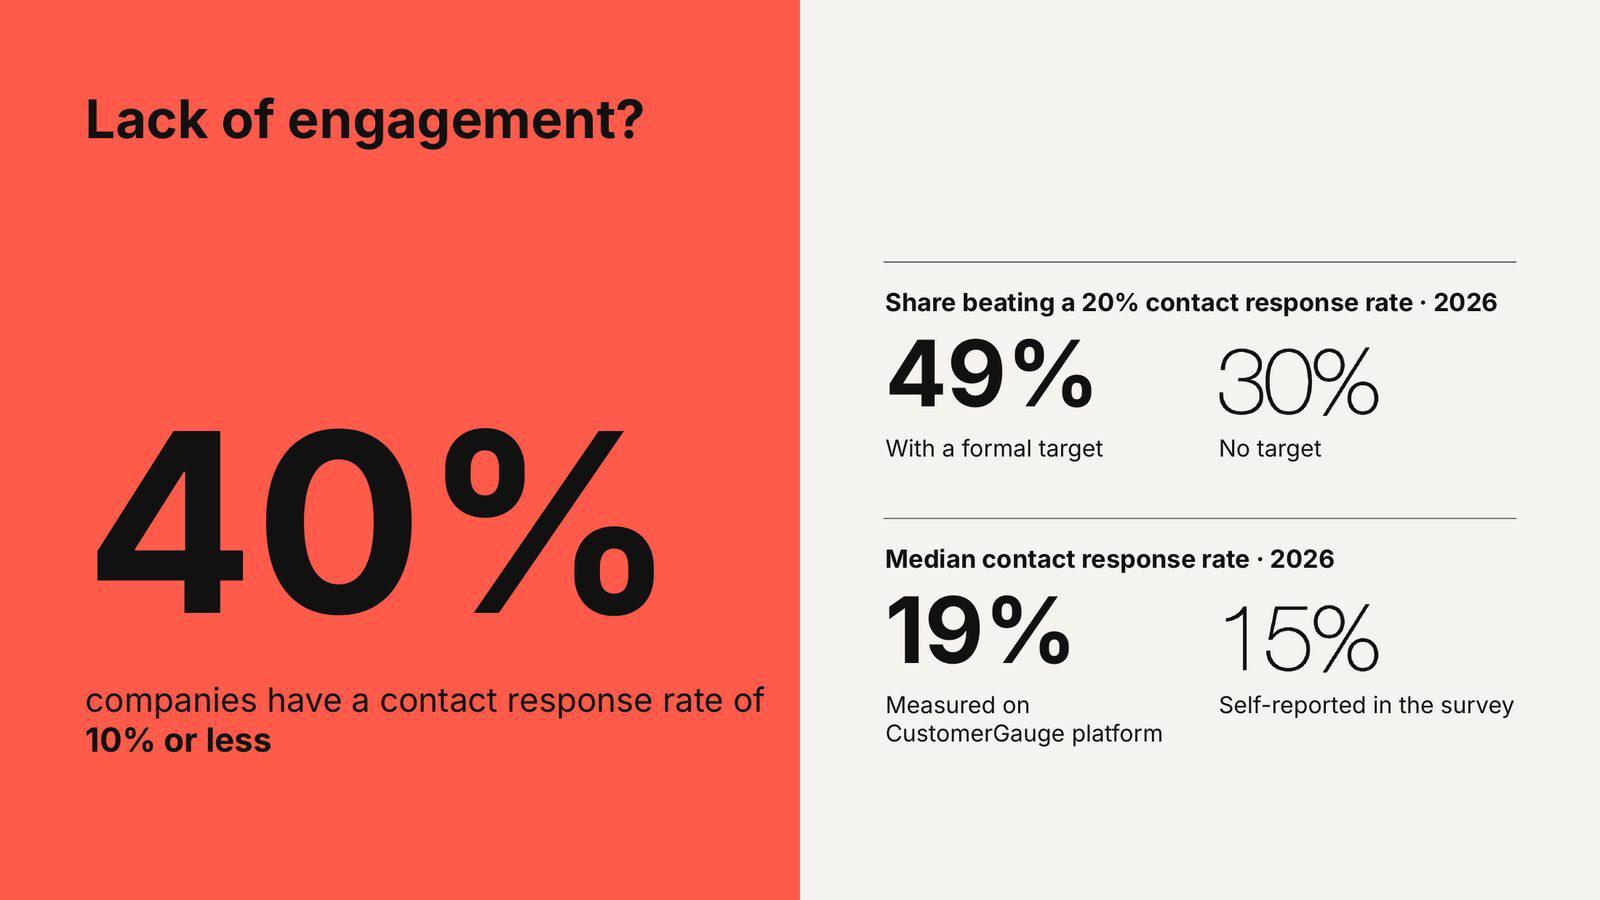
40% of companies have a contact response rate of 10% or less. With a formal target, 49% beat 20%; without one, 30%.
The cheapest trick in the book is setting a target. 49% of programs with a formal response-rate target beat 20%. Only 30% of those without one do. Response rate is a great KPI precisely because you can influence it. There is a long list of things you can do to improve it, which is what makes a target motivating. NPS itself is harder to target for the same reason: you have far less direct control.
Email response rates are drifting down across the market. Our customers who keep evolving their approach stay steady, and some grow.
Sidebar: Look at Your Cohorts
Hot off the press, from a healthcare provider's post-visit surveys (about 8,200 invitations, July to September 2026): response rises steeply with age, from around 6% for the youngest cohort to 41% for the 65+ group, and SMS beat email at every age. Not every cohort is worth the same. Find the pockets that are working, then work on the rest.
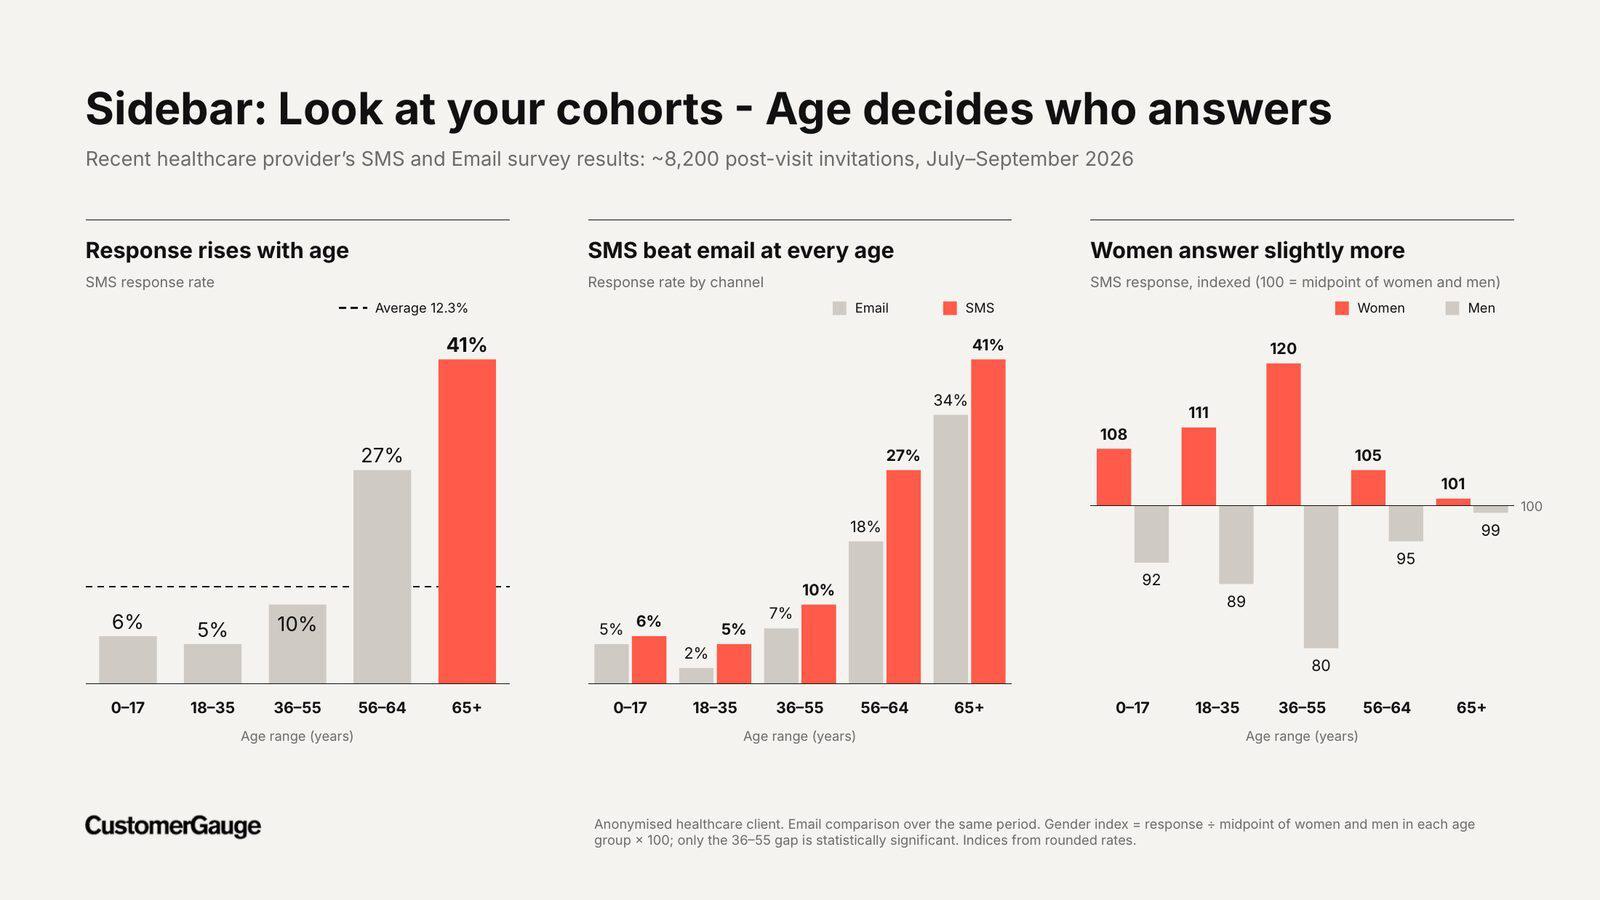
Age decides who answers. SMS outperformed email in every age range.
What Is a Good Response Rate?
Adam's honest answer is "I don't know," because it depends on your business. But here are the targets we'd use against the benchmarks:
- Contact response: 20% of individuals surveyed
- Account response: 40% of accounts, because some are worth far more than others
- Revenue coverage: 80%, which links straight back to the Reach % formula
Add multiple contacts per account, reach out to every client twice a year, and run what we call a 50-week culture: feedback spread across the year rather than one annual push, so it becomes part of the company's muscle.
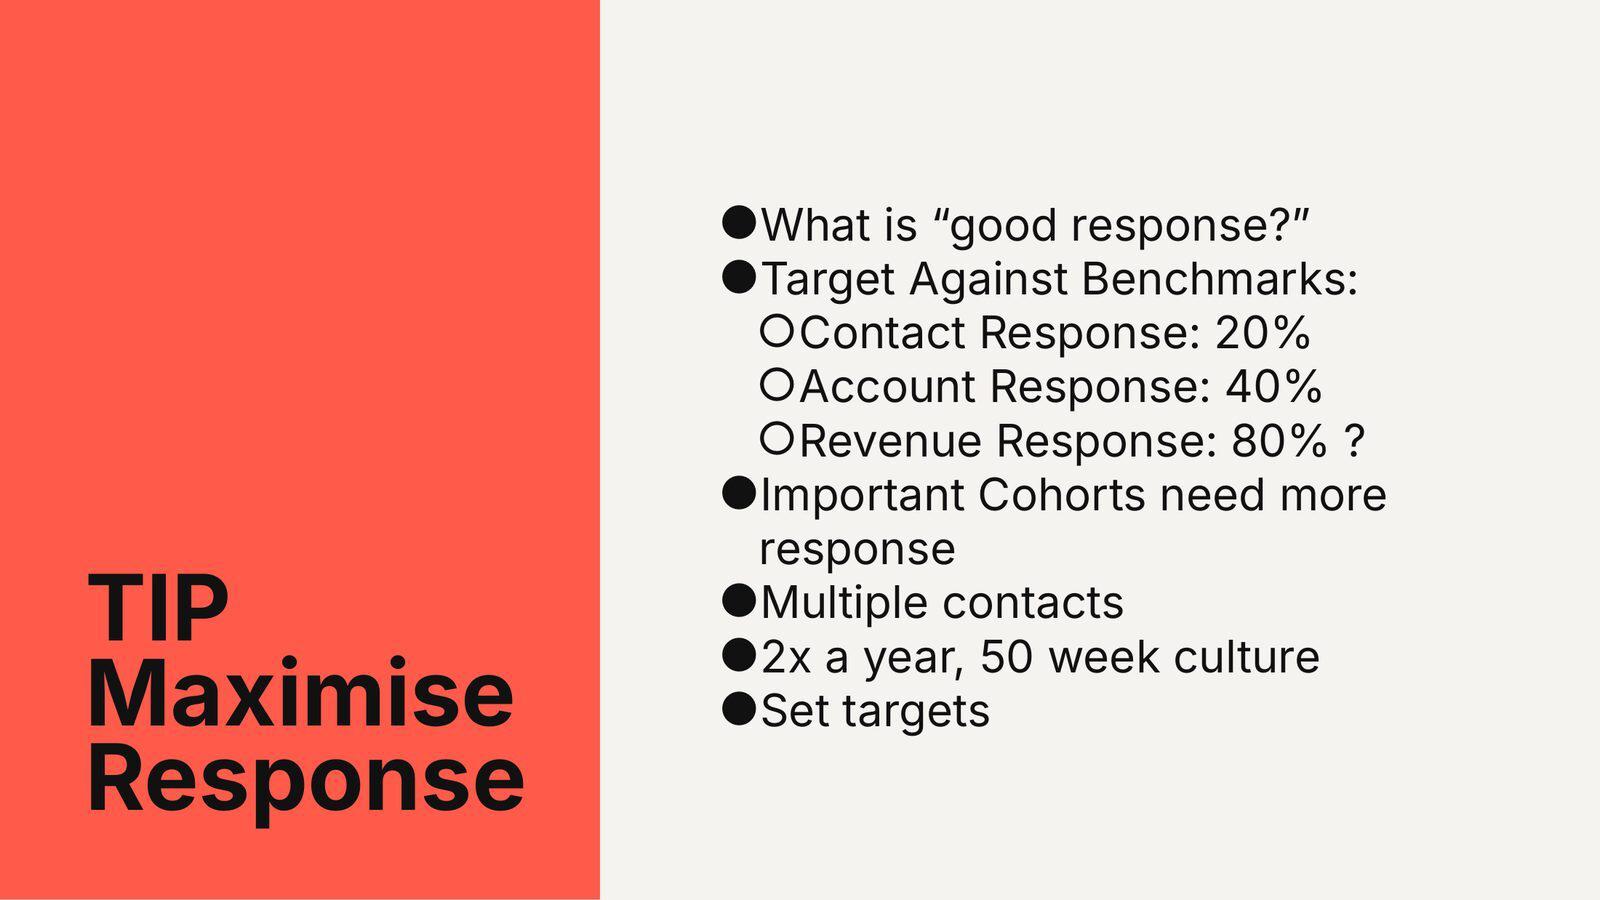
Target against benchmarks: 20% contact, 40% account, 80% revenue.
A Score Is a Snapshot. Revenue Is a Story.
This is some of the most exciting work we've done in years, and it comes straight out of the decade theme. Because we've tracked results for over ten years, we could look at individual contacts with 10 or 12 responses in a row, and roll those up to the account.
About 40% of respondents are repeat responders, and they account for 60 to 70% of all responses. At larger accounts we see 10 to 12 responses per contact over three years. That shocked some of our clients, and it changes what a program can do: you can see whether what you did worked.
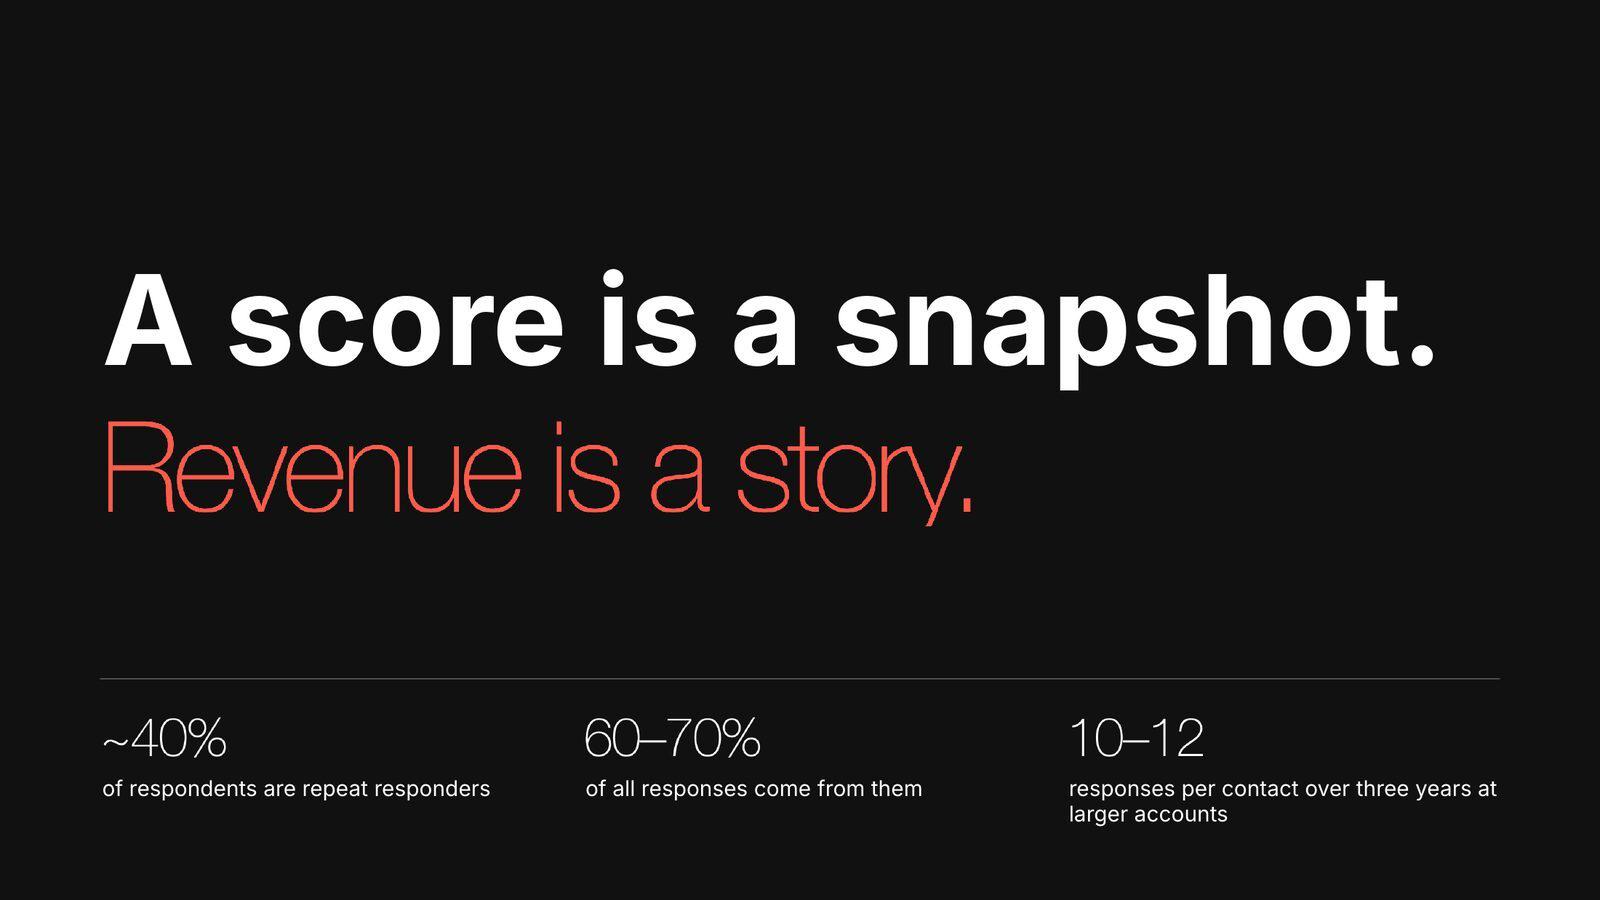
~40% of respondents are repeat responders, generating 60 to 70% of all responses.
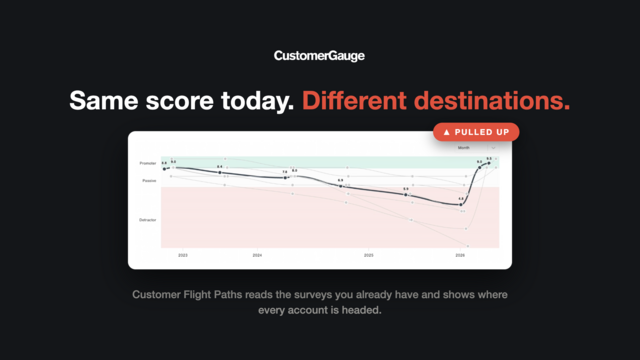
Doing this in spreadsheets is painful, so we built it into the platform. We call the result Customer Flight Paths. There are six:
- Level Flight – never leaves its loyalty band. Nines and tens the whole way, cruising in the stratosphere. These accounts grow faster than anyone else.
- Climber – crossed up a band and stayed.
- Descending – crossed down a band and stayed.
- Free Fall – one sharp drop between two responses.
- Off Radar – responded before, silent for two years. Off radar is never good, in aviation or in accounts.
- Pull Up – took damage and recovered.
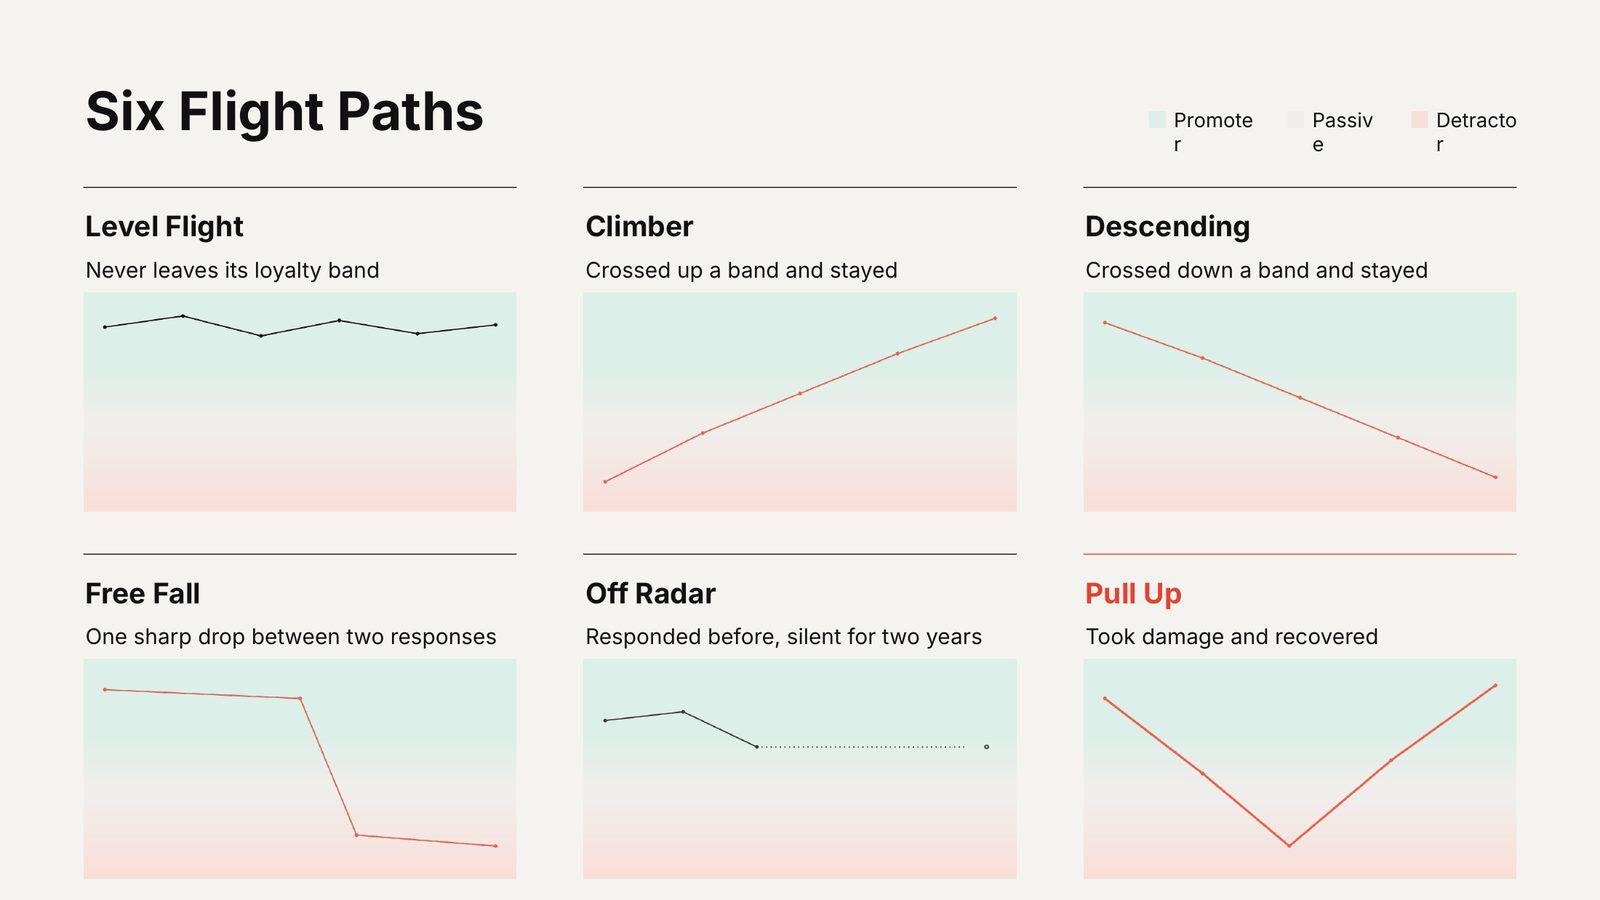
The six Customer Flight Paths.
Dips are operational. Rescues are people-led. It’s never the autopilot that pulls the stick.
Why a Rescued Customer Beats a Steady One
The Pull Up is the flight path that matters most. Picture a pilot blacked out, the plane in a steep dive, and someone reaching down to pull the stick up. A 10 that drops to a 5 and comes back to a 10.
When you measure both sides of the V, two things show up. The things that put accounts into a dive are almost always operational: issues that fall between departments, systems and procedures. They are endemic, and they will happen again. The things that pull accounts up are almost always people: a frontline team empowered to react fast, ask why, and fix it.
Daniel Kahneman's Peak-End Rule explains why this matters so much. The most recent experience wipes out earlier bad ones. Mathematically, rescued accounts get back to growing at normal rates, and sometimes beyond. You can't fix operational issues overnight; that is the long-term strategic work. But you can empower your people to rescue accounts this week, and that is where closing the loop earns its keep.
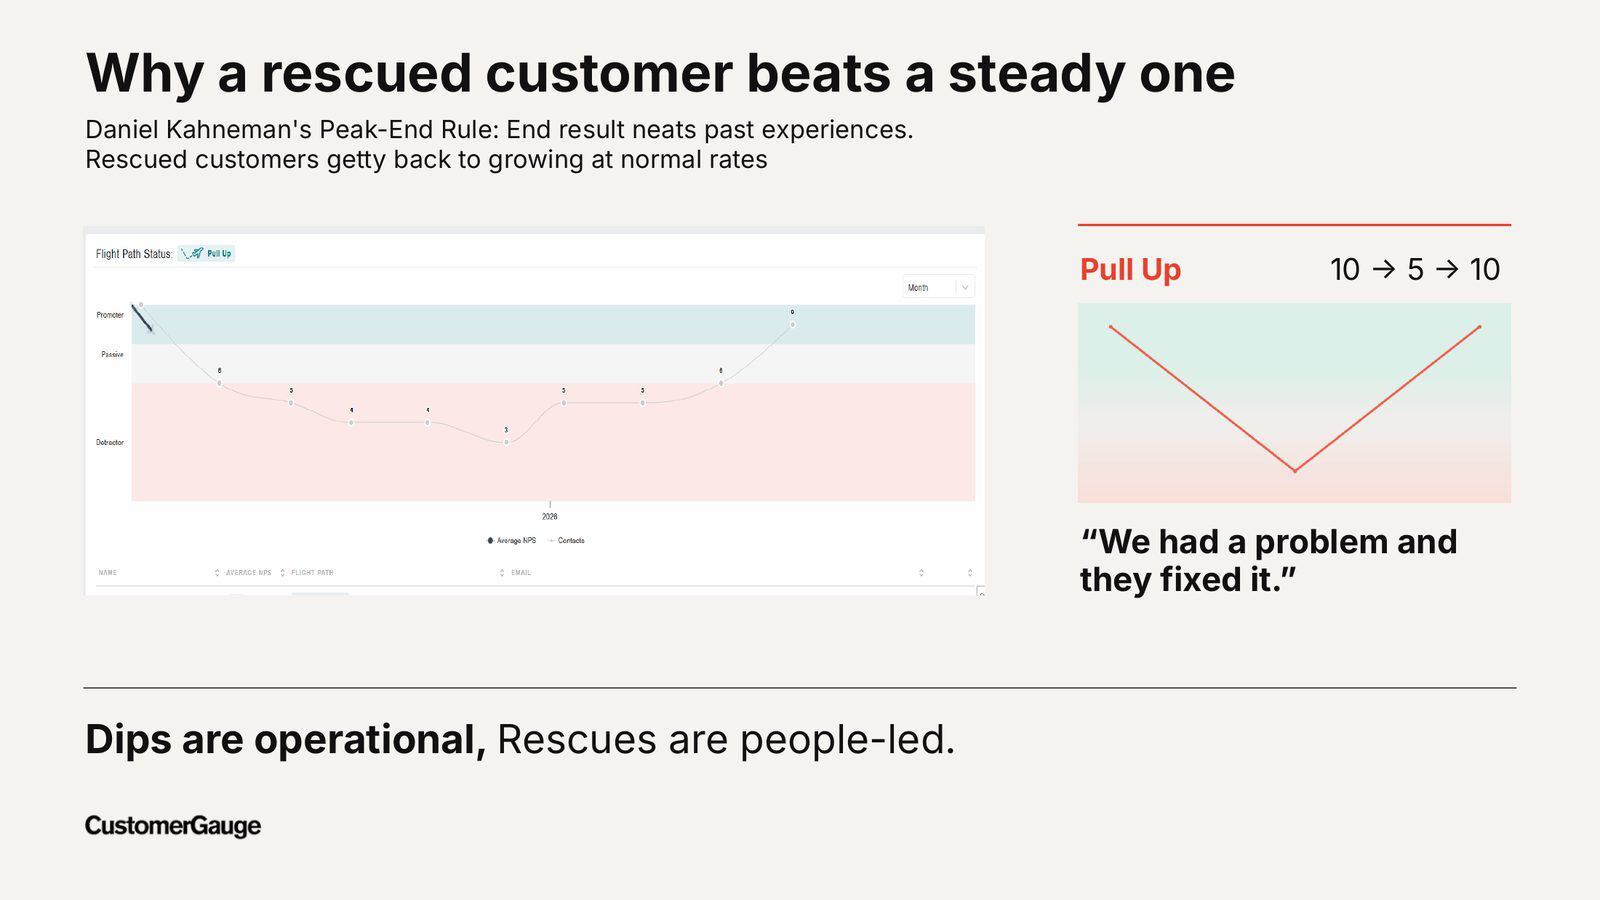
Three journeys, three memories. "We had a problem and they fixed it" beats "they're fine."
What Each Path Is Worth
The proof comes from an Asian beverage bottler: 42,000 responses across 39,000 accounts, with revenue verified against its own financials over a three-year horizon. The correlation between score and growth was r = 0.91 across more than 7,200 scored accounts.
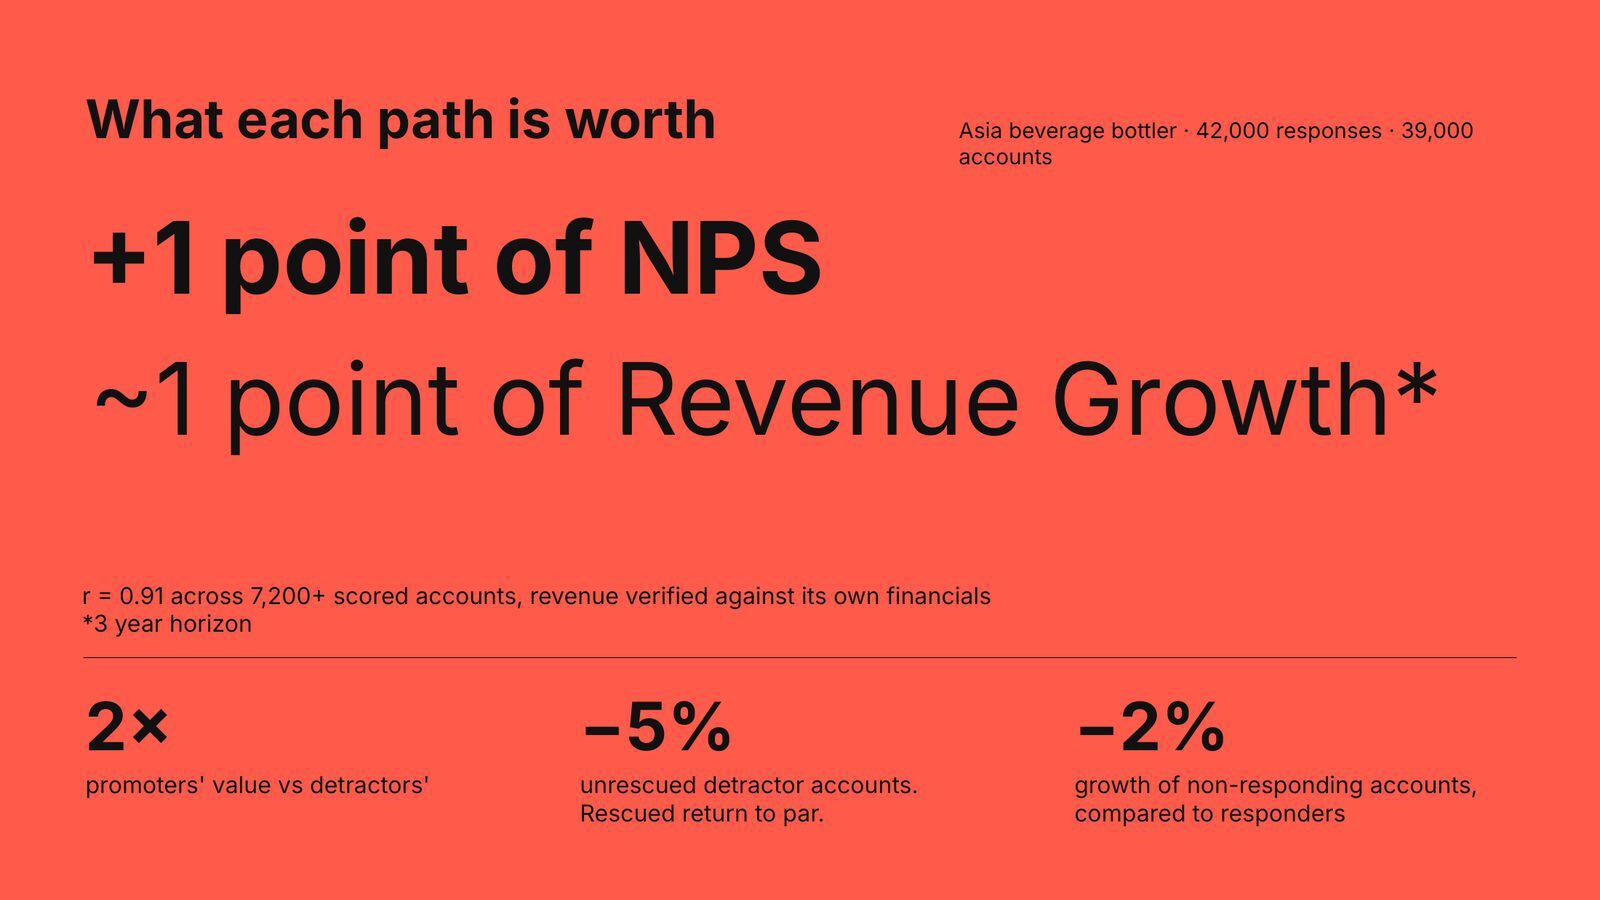
+1 point of NPS ≈ +1 point of revenue growth. Promoters worth 2× detractors. Unrescued detractors shrink 5%; rescued ones return to par.
One point of NPS was worth roughly one point of revenue growth. Promoters were worth twice what detractors were. Unrescued detractor accounts shrank by 5% while rescued ones returned to par. Non-responding accounts grew 2% less than responders. This is why you monetize: without the revenue link, none of this is visible, and you are back to justifying your existence.
The Benchmarking Paradox
Practitioners rate the importance of benchmarking at 8.5 out of 10, and 85% of the people we spoke to contributed data, which is why the report exists. But only 20% think they benchmark well. It is hard. The honest way to do it is to go and ask your competitors, and nobody does that.
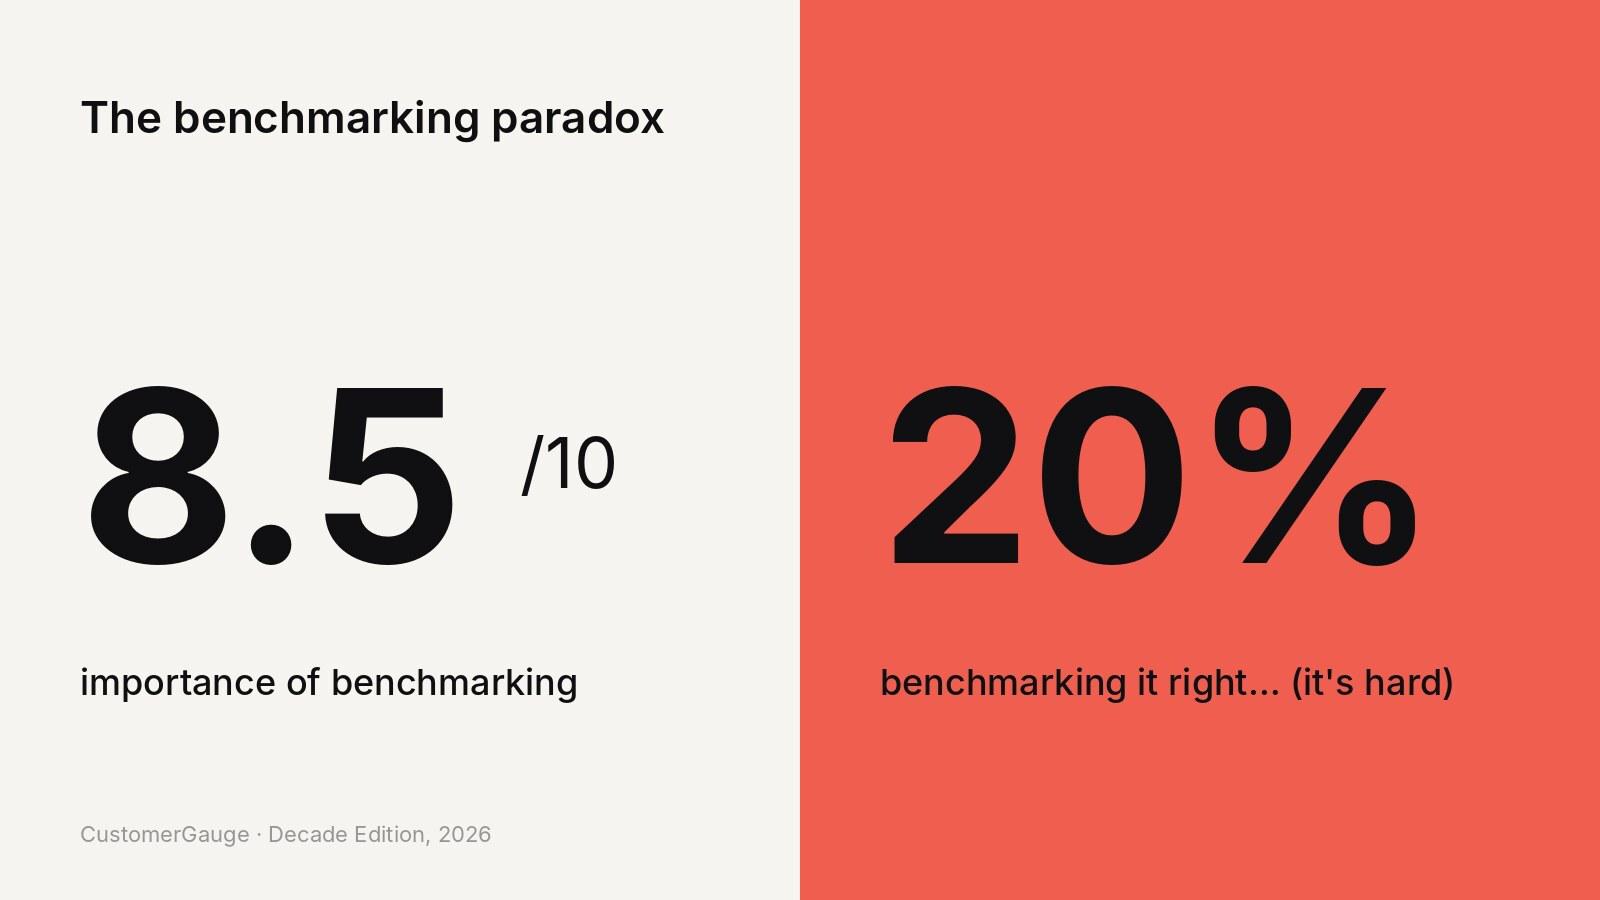
8.5/10 importance. 20% doing it right.
We can simulate it because we have ten years of data, so here is the decade benchmark by sector.
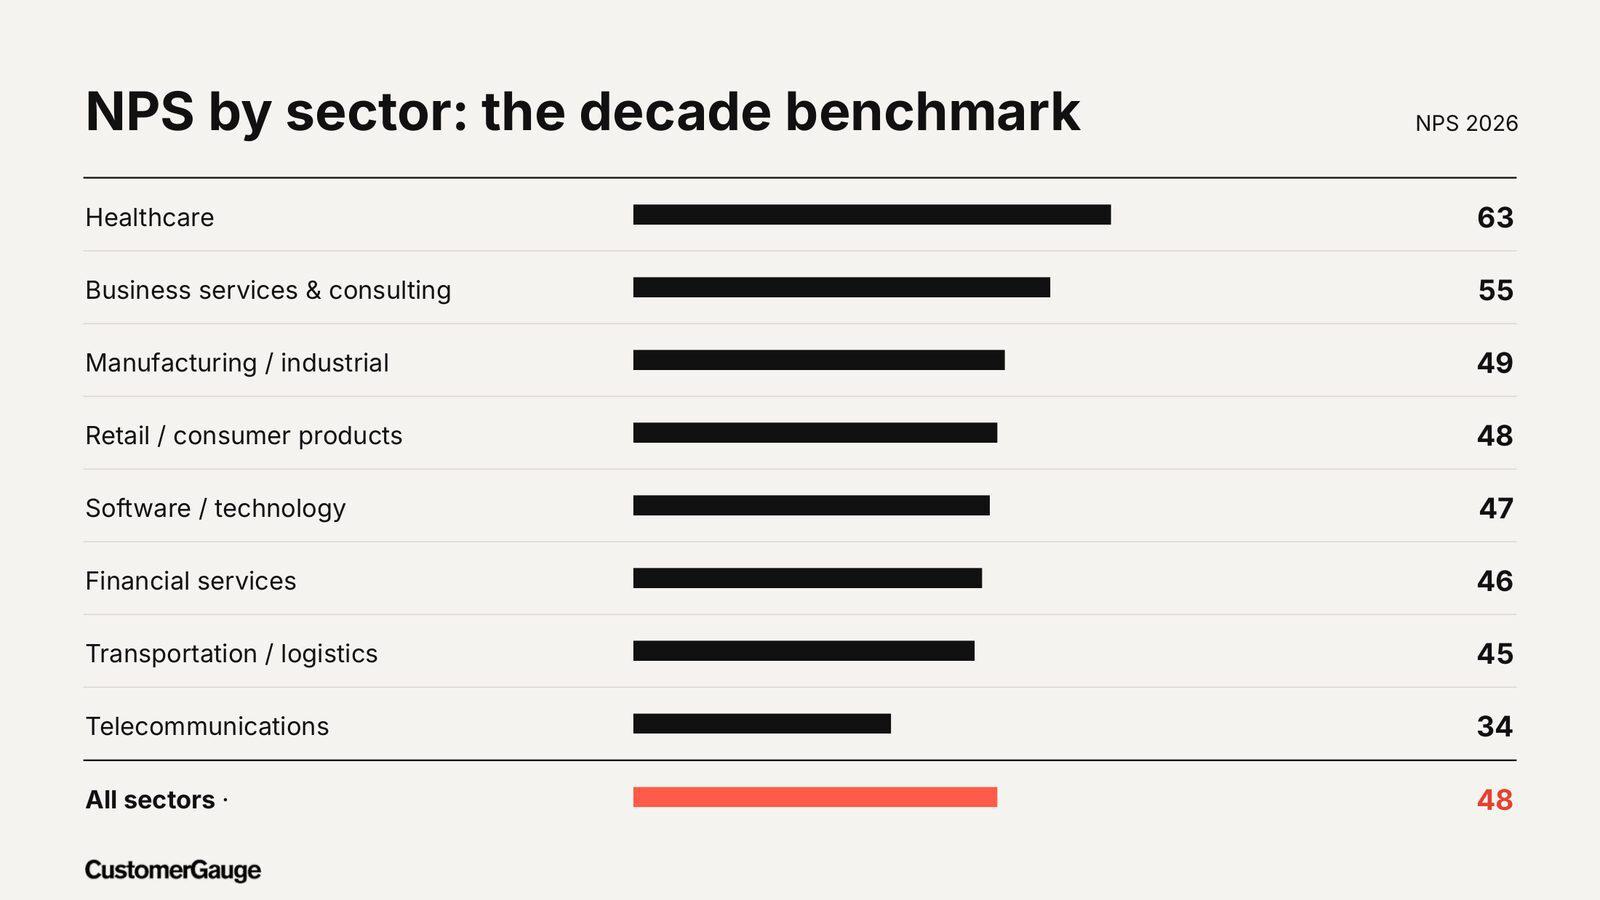
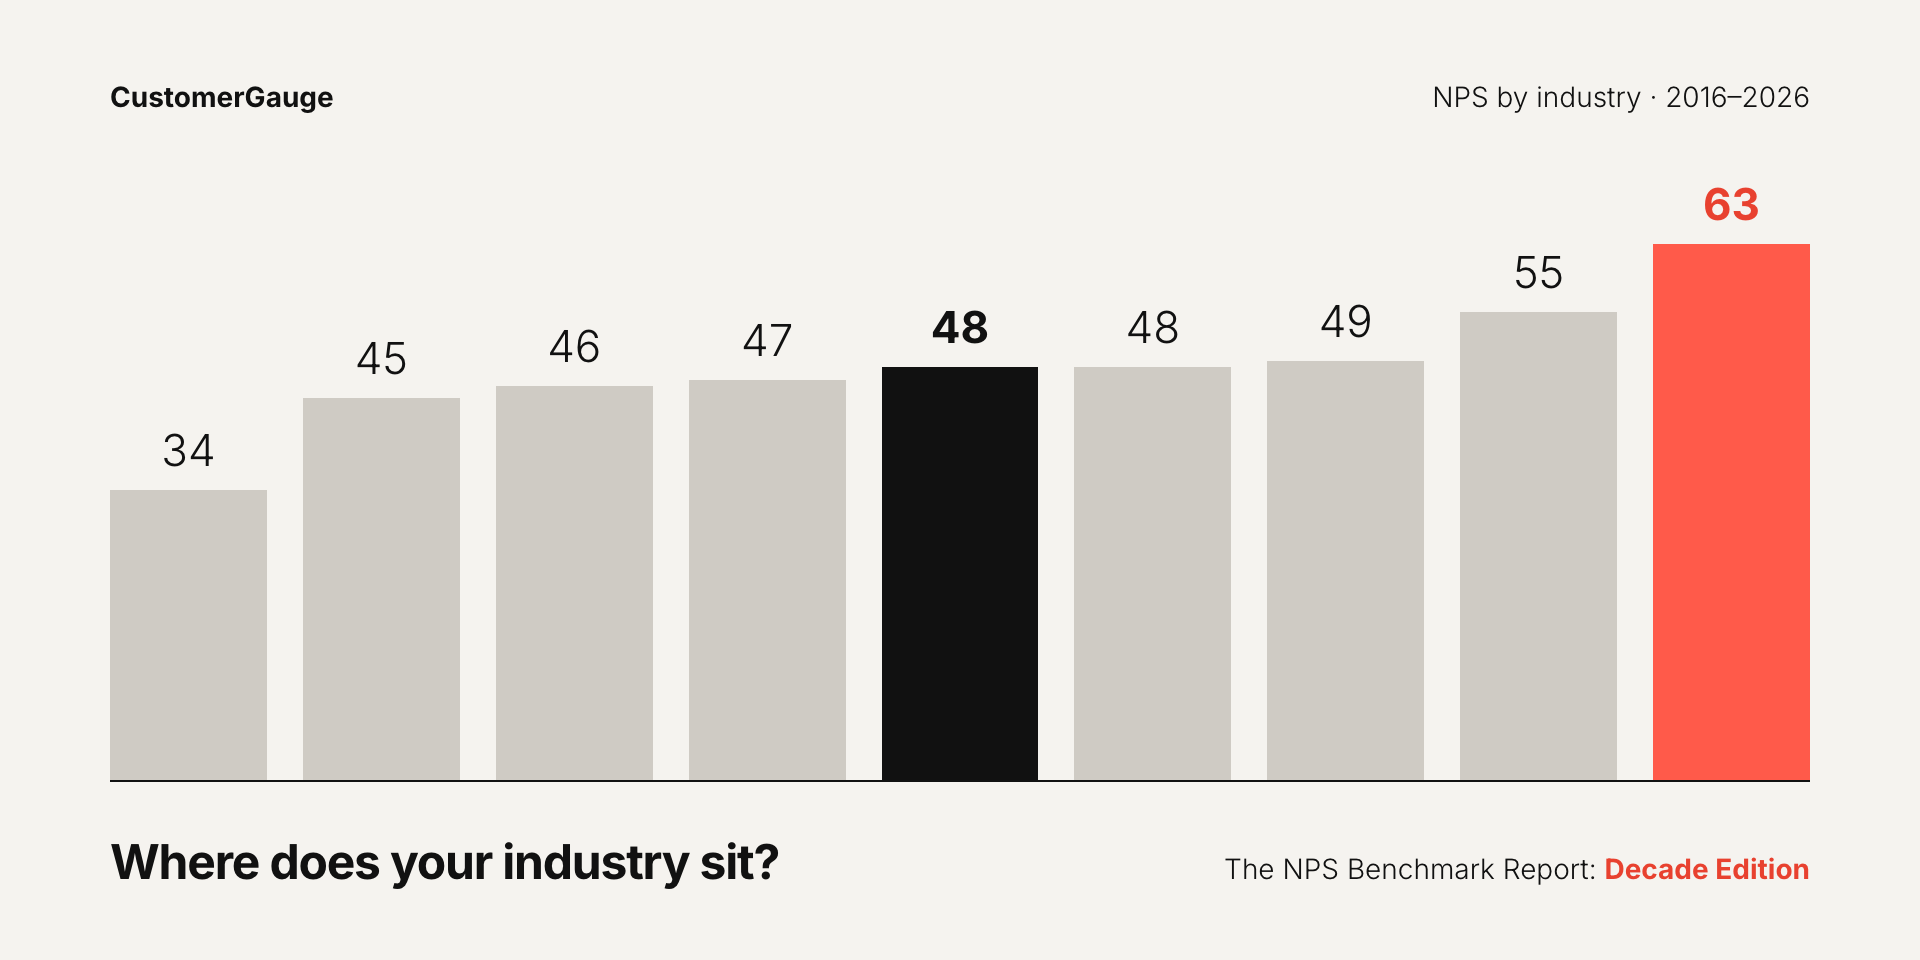
NPS by sector, 2026 decade benchmark. All sectors: 48.
Healthcare leads at 63, followed by business services and consulting at 55, manufacturing at 49, retail and consumer products at 48, software and technology at 47, financial services at 46, transportation and logistics at 45, and telecommunications at 34. The cross-sector benchmark is 48.
We benchmark ourselves too. CustomerGauge's full customer base sits at 52, and the UK customer group we hosted in September scored 59, against a software benchmark of 47. The rule of thumb Adam uses: above 50 and you are in good NPS territory.
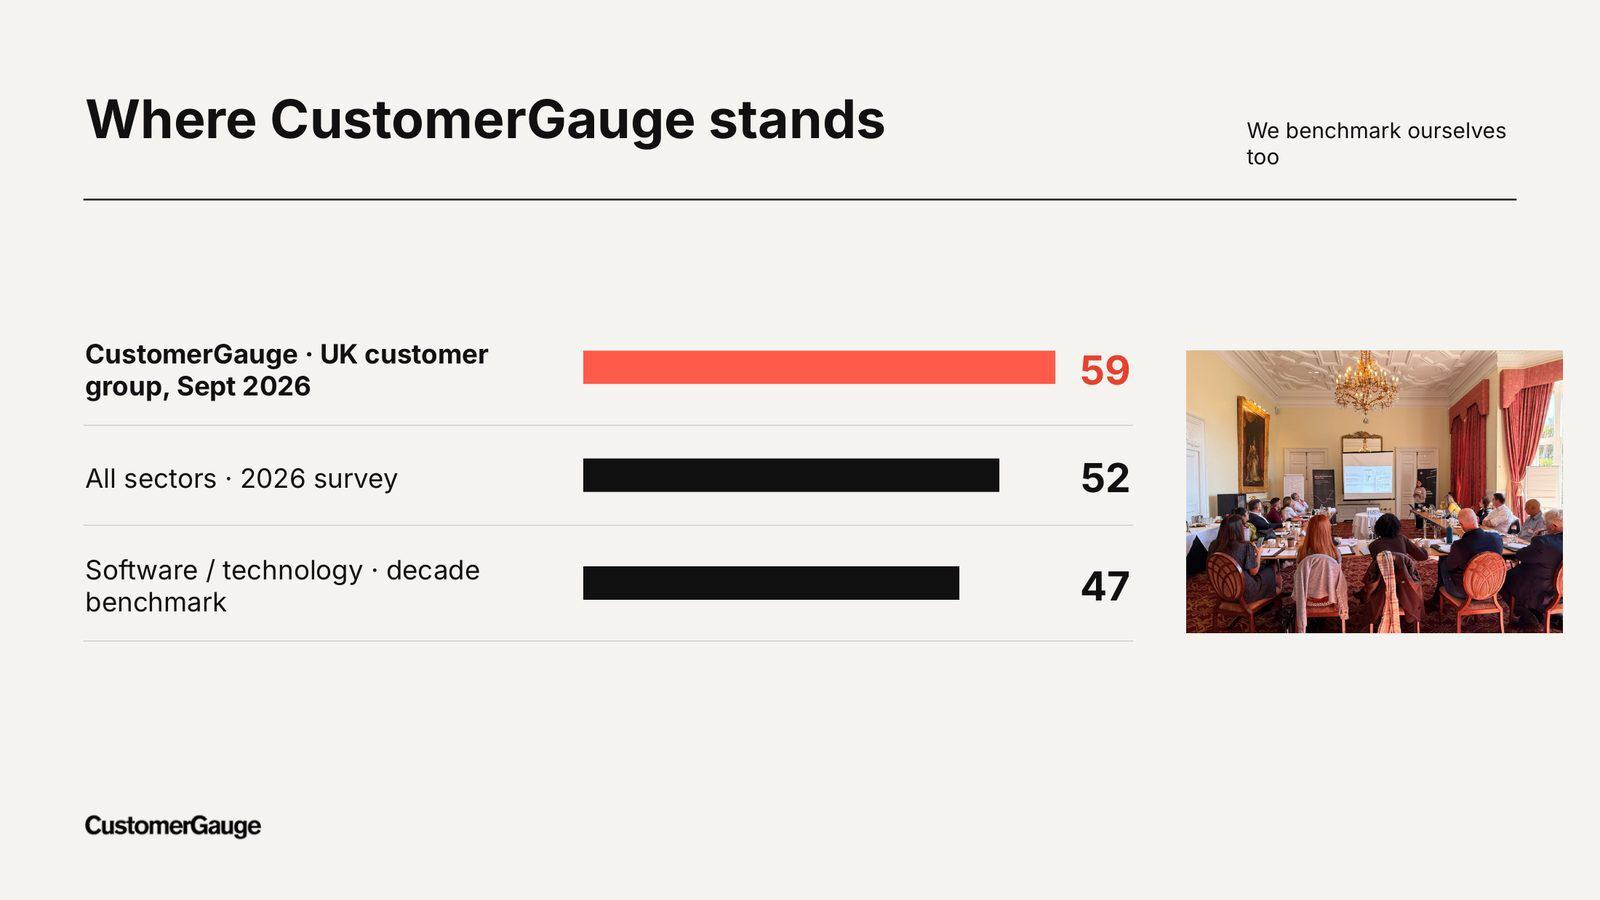
CustomerGauge UK customer group 59, all customers 52, software benchmark 47.
Is NPS on the Way Out?
The critics are loud on social media. The numbers say the opposite. Our NPS-Intelligence.com database now holds 6,136 public NPS disclosures from 3,896 named companies, each with a source. Disclosures are up 71% on last year and 2026 is on pace for around 1,840, nearly four times 2017. When Qantas, T-Mobile, CIBC, Macy's and Deutsche Telekom put NPS in earnings calls and annual reports, they are standing behind it. Boards and Wall Street are not fussed by the critics.
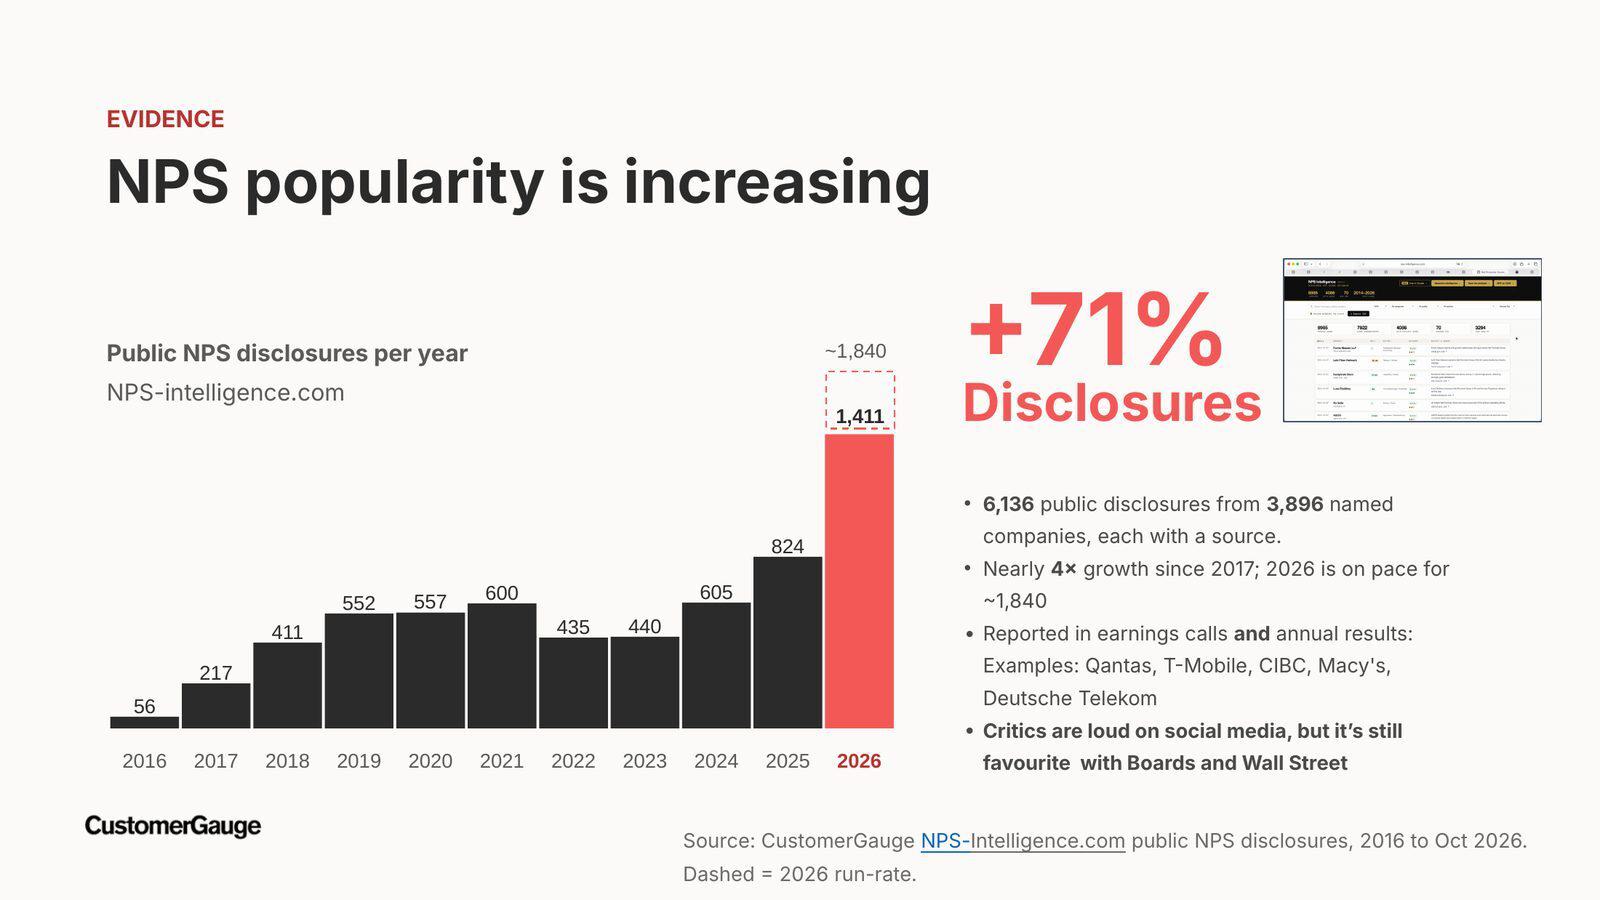
Public NPS disclosures per year, 2016 to October 2026. +71% disclosures year on year.
We aren't defending the metric for its own sake. We just happen to measure it, and it is becoming the industry standard for customer experience performance. Pick your battles.
Questions From the Audience
Do you have the same studies for CSAT or CES? No. We track news feeds for all three and hardly anyone publicly reports CSAT or CES. They are less established as standards, and monetization is far harder to prove against them.
How can you monetize when sales are influenced by so much noise? The same way marketing does: cohorts. Measure a group of customers on their experience, then see what percentage went on to buy more. NPS doesn't generate the revenue. It identifies which customers had a great experience and grew, and the drivers underneath tell you why. Flight Paths make that far more concrete because you can measure both sides of a V.
Should we run an always-on survey on the website? It is harmless, and some of our customers do it, but passive surveys mostly measure how your website performs on a task. They are weak at capturing likelihood to recommend. Prompted outreach by email or SMS does that. If you run one, someone has to read the responses.
Will unsolicited signal replace surveys? Signal intelligence is fantastic. You can learn an enormous amount from the communication you already have with customers. It doesn't replace asking. When you ask someone for feedback and they take the time to rate you and comment, that is a human act, and people inside your company will act on it. Ask them to act on a synthetic score and they won't. Asking also makes you vulnerable in the right way: it tells your customers you want to hear from them. Layer signal on top; don't swap it in.
Key Takeaways From the Webinar
Set targets for your program: revenue coverage, response rates at 20 / 40 / 80, and closing the loop in 48 hours or less. Build the playbook into your DNA: a 50-week culture, talk to every customer twice a year, tell them what you learned, and increasingly, publish your program on the web and bring it into sales calls. Prove it works by monetizing over time; it took some of our customers years, but they came out transformed. And benchmark yourself against everybody else.
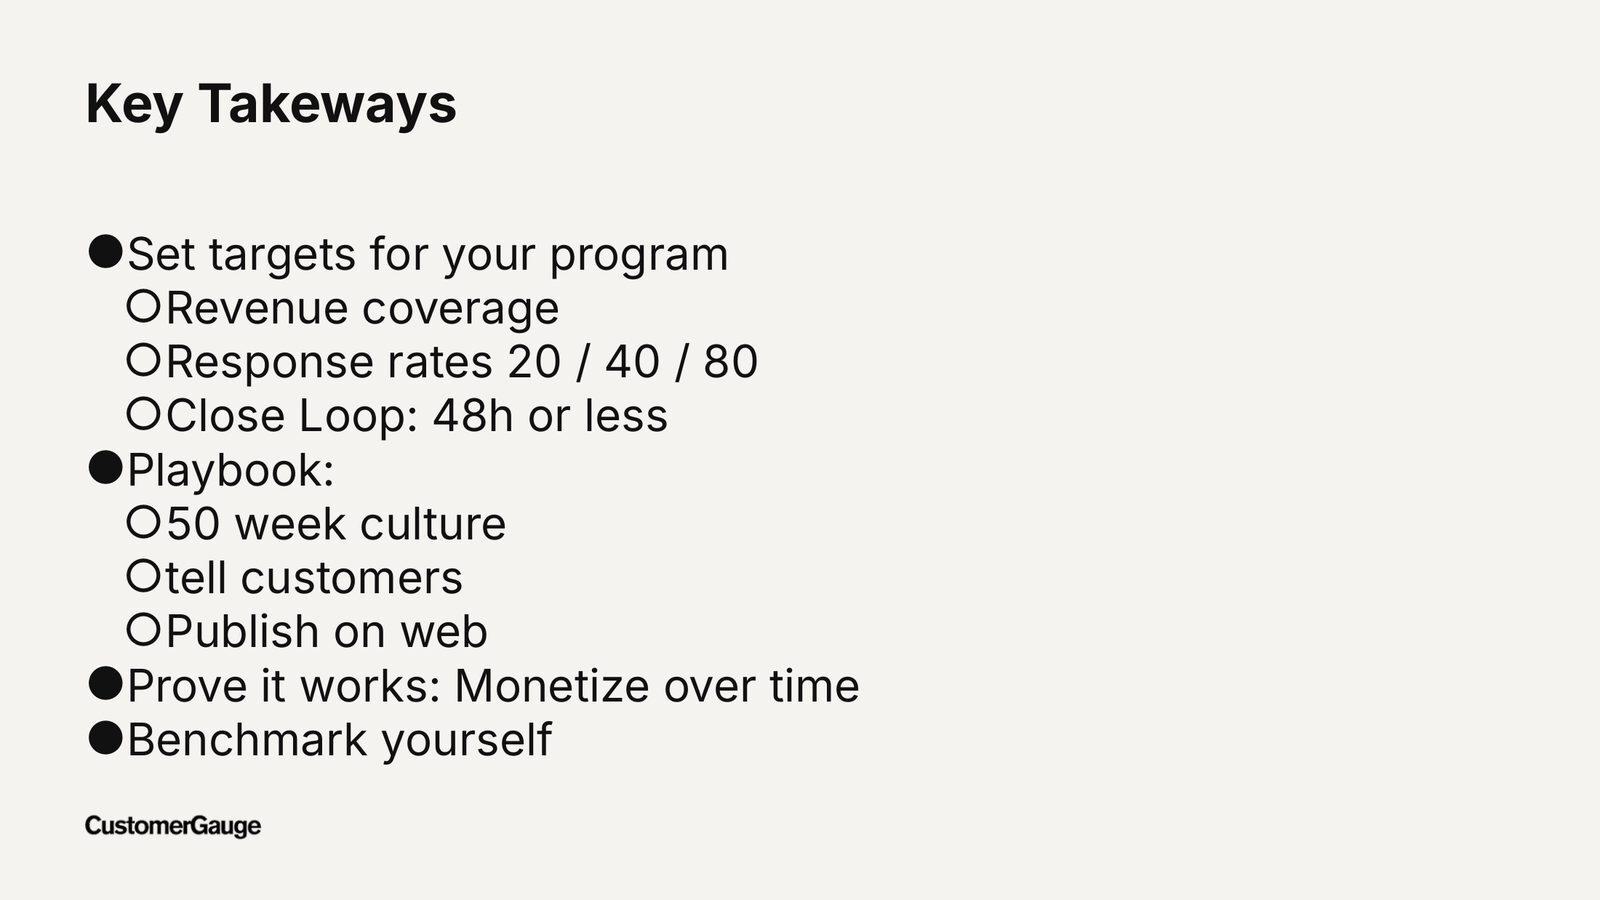
The webinar takeaways in one slide.
Get Your Decade Benchmark Readout
For the first 20 qualifying registrants this quarter, we are running an in-depth, custom benchmarking session. We pull every available benchmark, including NPS Intelligence disclosures and any NPS mentions on your website, and score your program against the whole CustomerGauge client base, your sector and its leaders, on eight dimensions from reach and monetization to closed loop and AI.
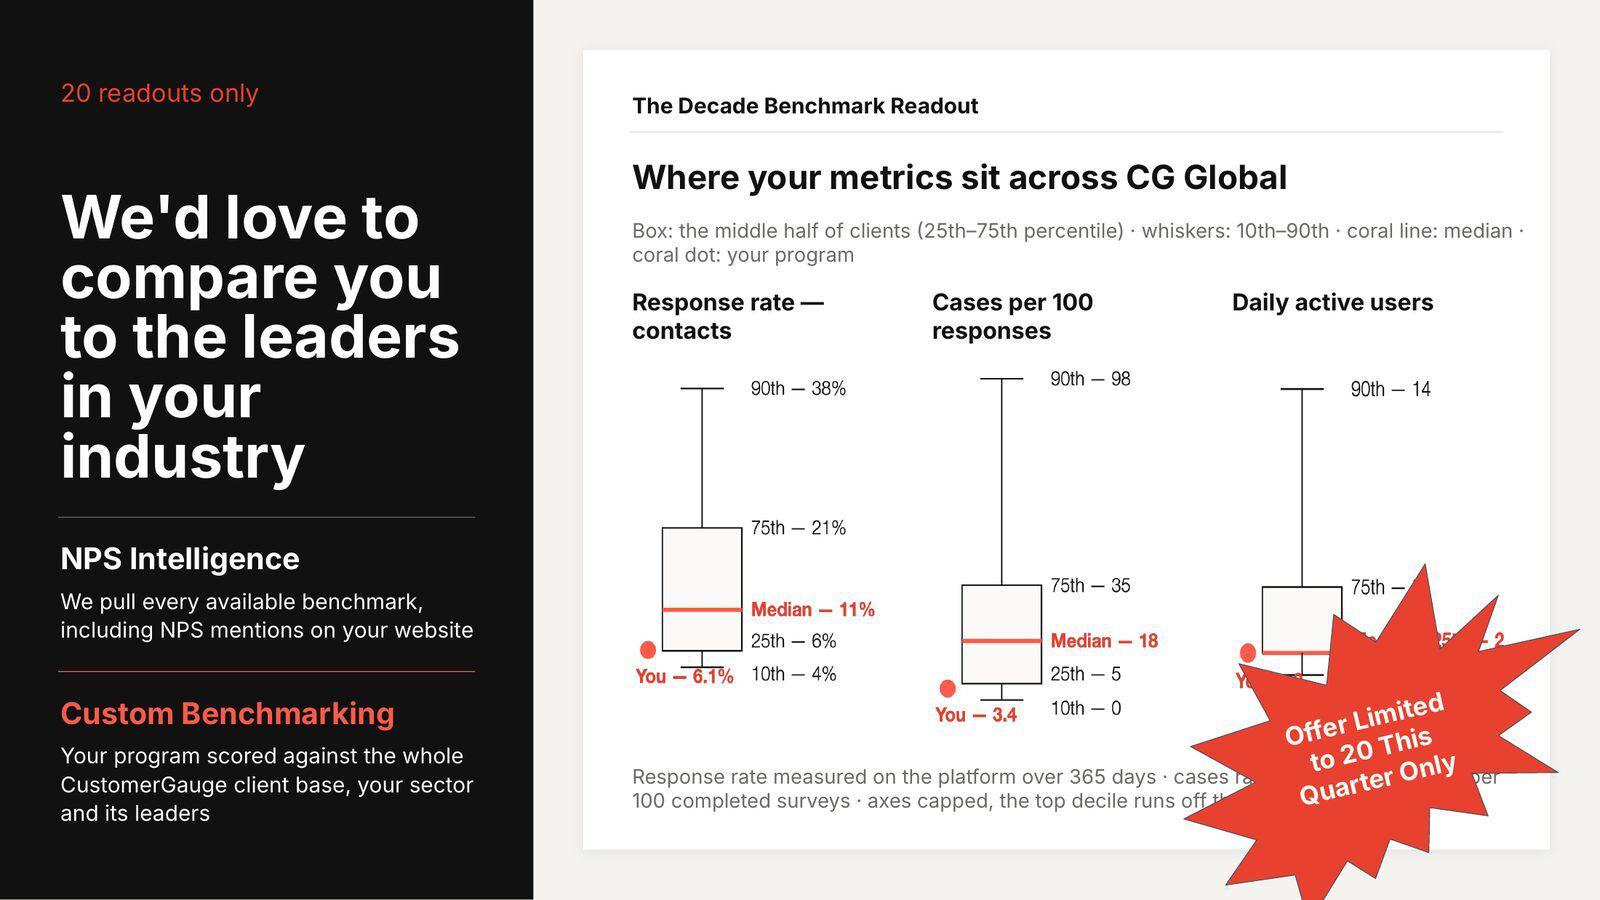
Where your metrics sit across CG Global: the middle half of clients, the top and bottom deciles, and your program.
How it works: apply with four questions in one minute, then a 30-minute program discovery call, and your readout within 15 days.
Apply for your readout · Read the Decade Edition report
Go Beyond the Snapshot
If the Flight Paths section caught your attention, read Beyond Promoters and Detractors: The Six Flight Paths Every B2B Account Follows for the full breakdown of each path and what to do about it on Monday morning.
CX businesses that close the gap stop being the first budget cut in a hard year, and start being the reason the hard year isn't.
About the Author