


Every industry faces (and finds strategies to fight!) customer churn.
Anyone wanting their business to succeed constantly has a finger on the pulse of how the competition is keeping customers happy.
If you’re this someone, you likely have already calculated your churn rate and looked at the revenue tied to those numbers — after all, understanding the ROI of your customer experience (CX) program is what shows an accurate dollar and cents picture of what churn is actually costing you.
Now that you have your data, the next step is to use industry benchmarks to measure your performance against internal and external standards.
Why? Well, you want to see if your customer churn rate is any good, and that depends on your industry. There's no point benchmarking yourself against the average for wholesale firms when you’re a specialized IT service or software business.
So, what are the average churn rates of the major B2B industries? We couldn’t find them either, so we gathered the data ourselves.
For our recent B2B NPS® & CX Benchmarks Report, The State of B2B Account Experience, CustomerGauge set out to create the most comprehensive B2B Account Experience benchmarks report on the planet.
We sought to find cross-industry averages in Net Promoter Score and customer retention rates and examine the trends and metrics of 11 major B2B-focused industries from consumer packaged goods to telecommunications.
This is what we found:
Median Customer Retention Rates by Industry 2025
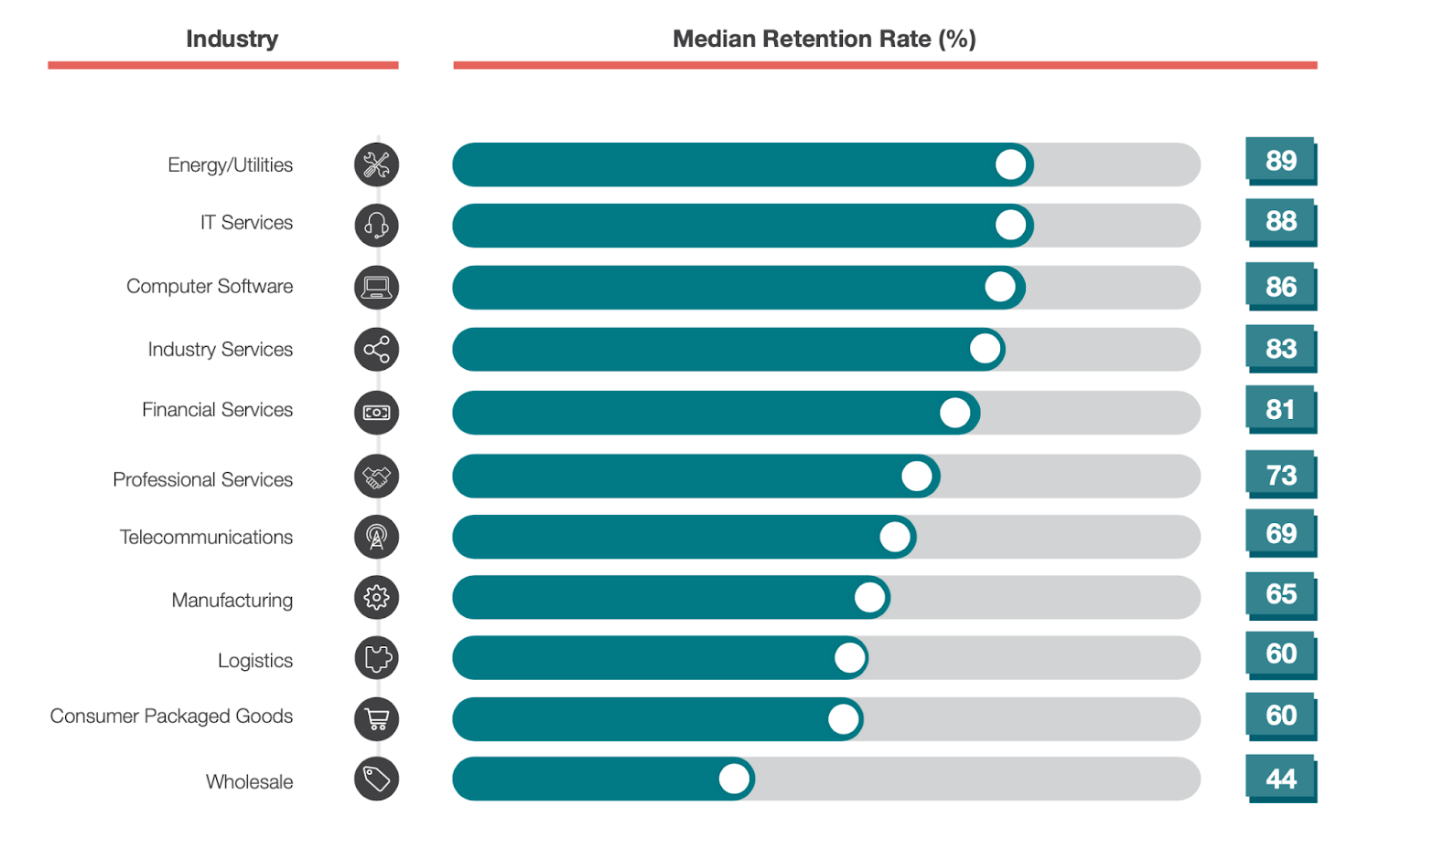
To calculate churn from retention just subtract the retention rate from 100:
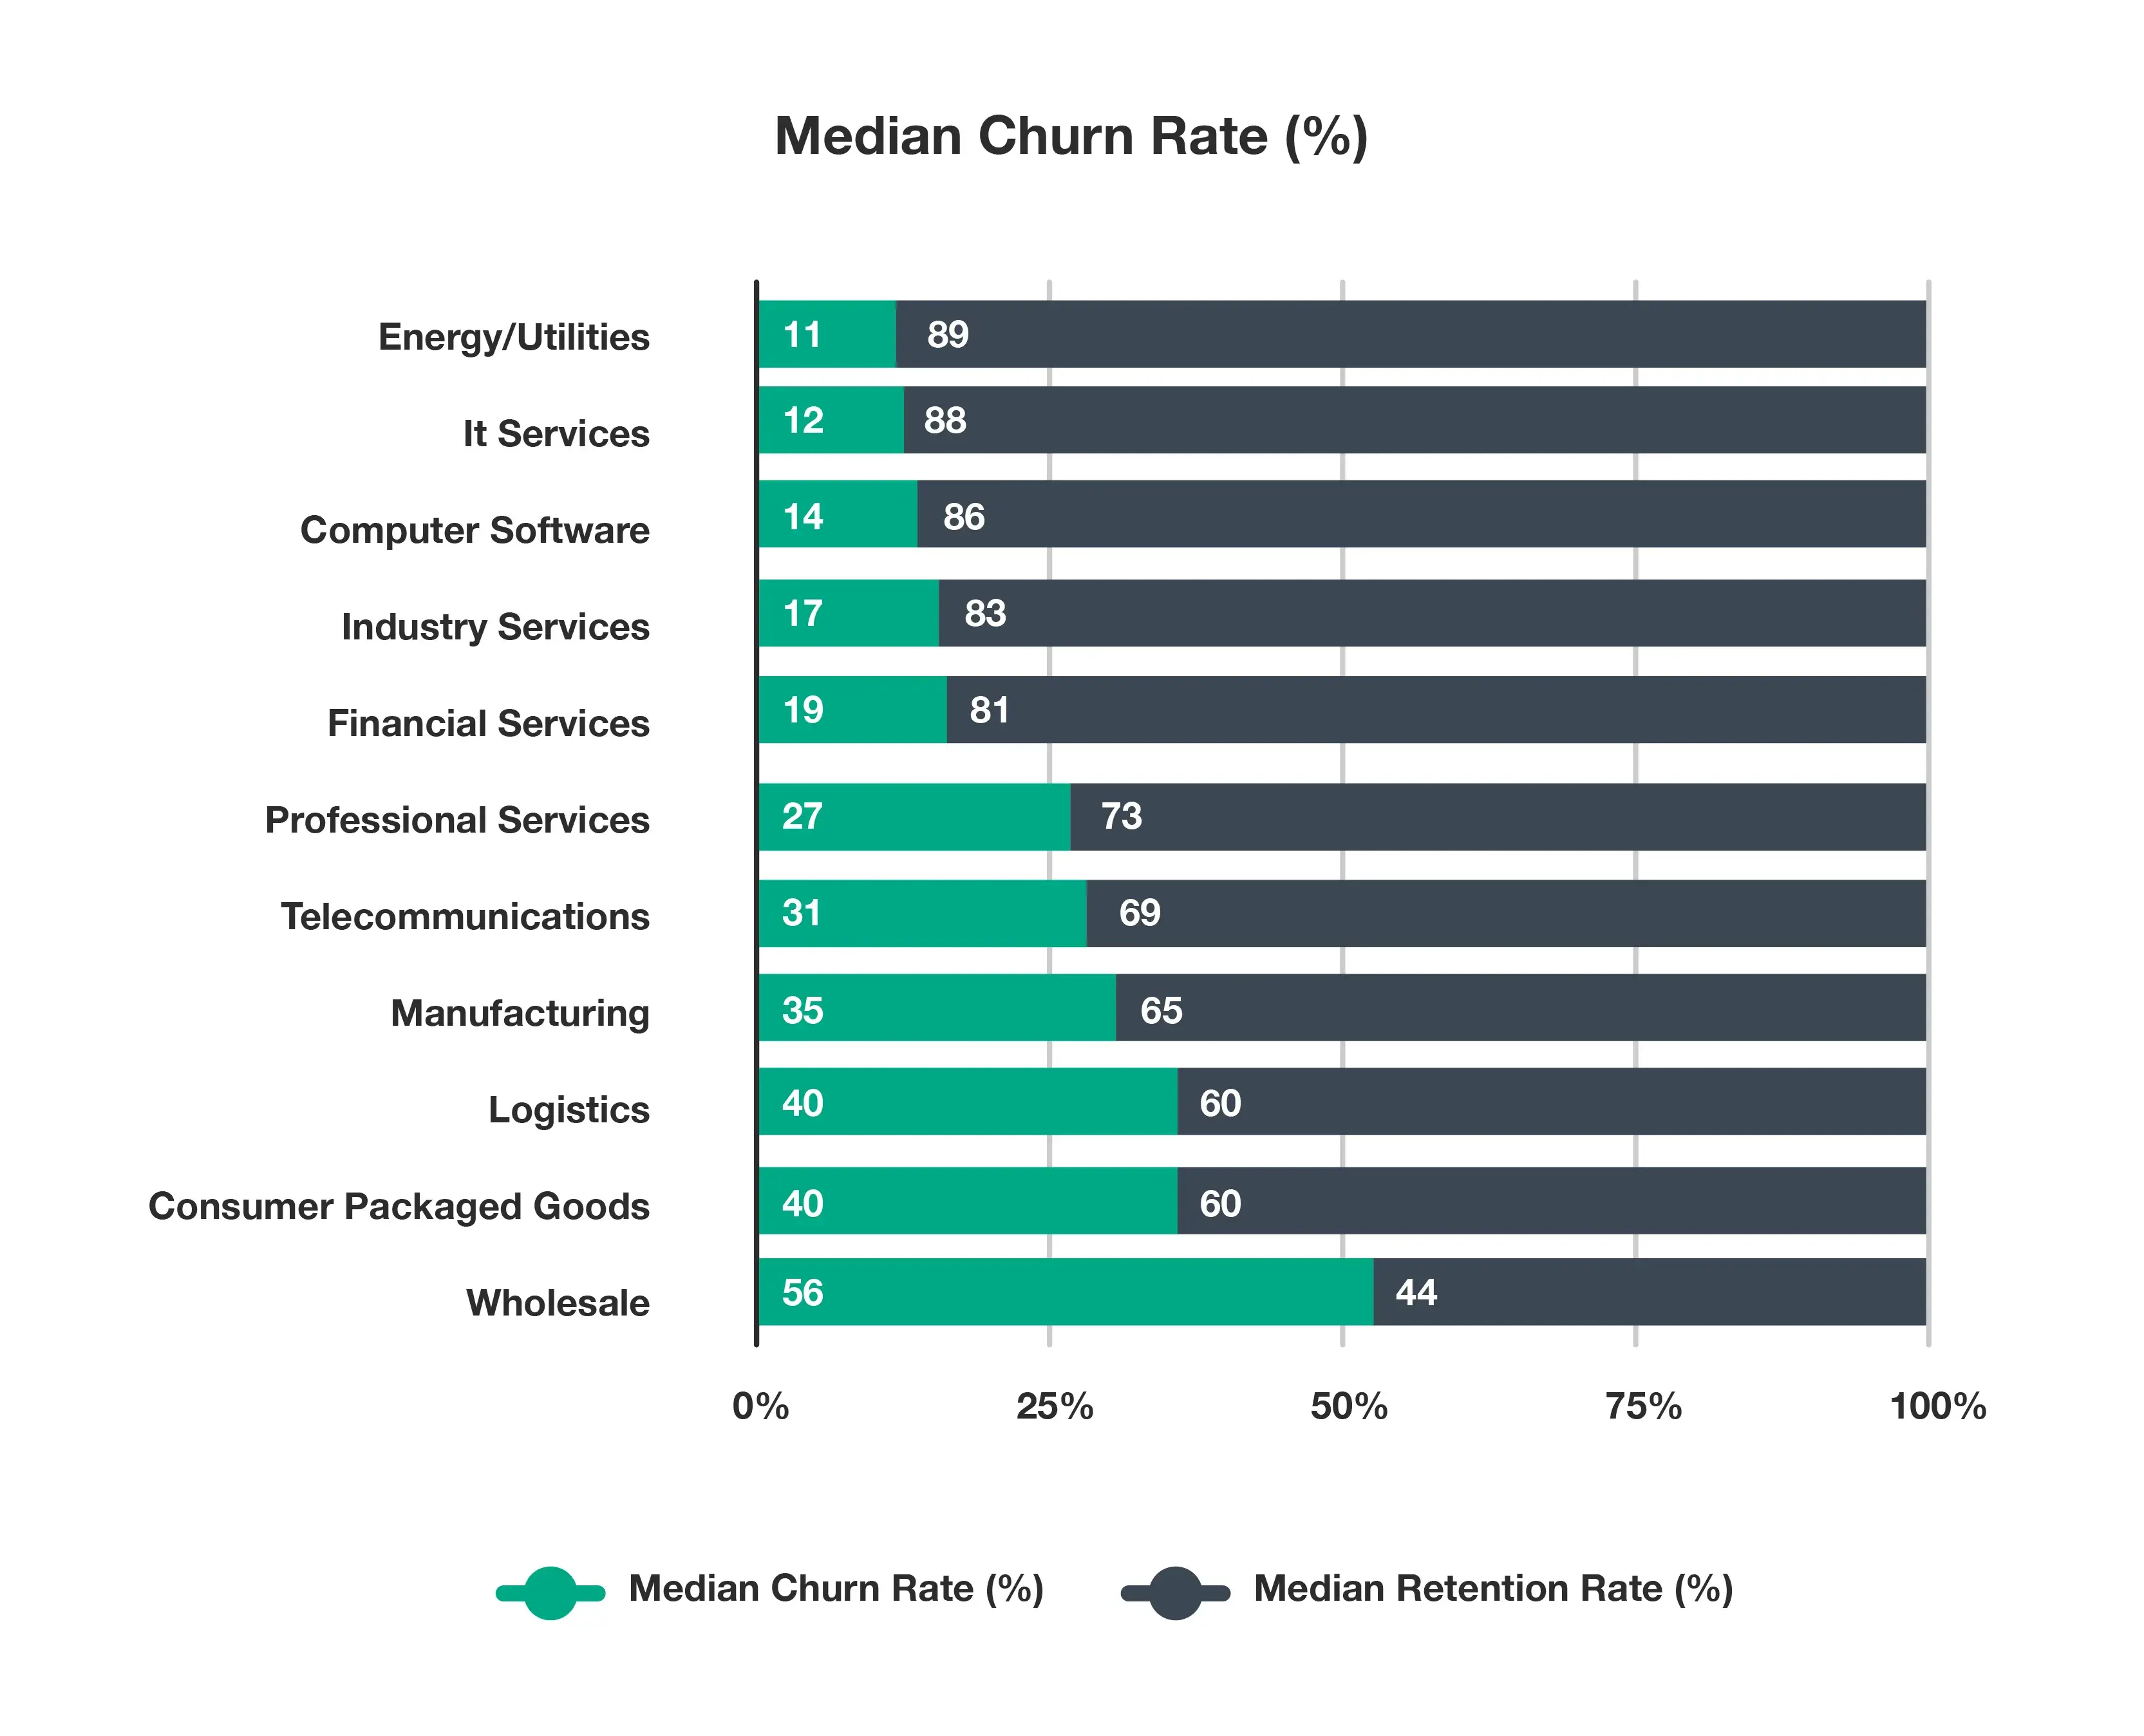
Median Customer Churn Rates by Industry 2025
Now, let’s dive into the details.
Average B2B Churn Rates by Industry (2025 — CustomerGauge Research)
Energy / Utilities: 11% | IT Services: 12% | Computer Software: 14%
Industry Services: 17% | Financial Services: 19% | Professional Services: 27%
Telecommunications: 31% | Manufacturing: 35% | Logistics: 40%
Consumer Packaged Goods: 40% | Wholesale: 56%
Source: CustomerGauge State of B2B Account Experience report. Based on primary research across 11 B2B industries. To calculate churn from a retention rate, subtract the retention rate from 100.
Average Churn Rates by Industry
Customer churn rate is the percentage of customers a business loses over a given period, calculated as: (Customers Lost During Period / Total Customers at Start of Period) x 100. In B2B contexts, churn is typically measured annually and tracked at the account level rather than the individual user level, since a single account may represent thousands in annual recurring revenue. A lower churn rate means higher customer lifetime value, more predictable revenue, and stronger unit economics.
Energy / Utilities: 11%
As an energy or utility supplier, you should be concerned if your B2B customer churn rate is much above the industry average of 11%.
B2B energy customers are often slower to churn because energy contracts tend to last longer and customer experience interactions tend not to occur as frequently as in other sectors.
Also, whether or not your region or state has deregulated energy suppliers has an impact on average churn rates. Suppliers may see unusually high levels of churn in 2022 as customers scramble to escape the ballooning energy prices driving global inflation as well.
Besides these factors, the stability of the B2B energy market is down to simple requirements by customers: energy efficiency, predictable and reasonable rates, and easy-to-follow, self-service interactions with providers.
Offer these and a strong CX program, and you’ll have the customer loyalty you’ll need to help you weather the turbulence currently forecast for global energy markets.
IT Services: 12%
IT is another sector where average customer churn rates are lower than most, around 12%.
While it’s a competitive space, B2B businesses tend to be slower to churn away from IT service providers due to a perception that change will cause business interruptions. This advantage is likely to be strengthened in 2022 and beyond, with IT support having proved itself so indispensable to businesses during the pandemic.
The move to managed service models is a continuing trend for businesses in this sector, with around 64% of IT providers offering some kind of managed service program in 2022.
Changes to the landscape, such as the rapid rise of cloud computing, have necessitated changes in strategy for many of them, including an increased need for greater customer experience focus.
If a move to more managed services is one you’re considering, make sure you have your high-value customers’ loyalty with a solid Net Promoter System before you transition.
This is exactly what CustomerGauge did for the CX team at Effortless Office in 2020. After they lost a huge account with no forewarning, we were able to deliver results with NPS in just four days.
That gave the team much more accurate insight into their customers’ true account experience, so they could proactively maintain and grow their loyalty.
Knowing your industry benchmark is step one. Knowing what to do with a churn rate that's above it, or building a system to keep it below it, s where CustomerGauge comes in.
CustomerGauge is the only NPS and account experience platform built specifically for B2B. It gives you account-level churn visibility before customers decide to leave, closed-loop workflows to act on feedback, and the benchmarks to know how you're doing relative to your industry.
Computer Software: 14%
Software proved itself indispensable during the pandemic, as not just companies but whole industries were forced to adapt to online modes of delivery. Despite economies starting to open up again, that ‘digital-first’ approach has remained a reality.
The growth in the software industry means more opportunities for software businesses, and the growing capabilities enabled by 5G, artificial intelligence (AI), and low-code and no-code tools will provide new efficiencies and space for innovation.
However, it also means more competition and the risk of higher customer churn.
At the moment, average churn rates for software companies are 14%, according to our research. But, this is tighter when it comes to SaaS specifically. According to Recurly, average B2B churn rates within this subsector are much lower: 4.67%, while Pacific Crest found the annual median churn rate for SaaS providers is 10% or lower.
That being said, with a laser focus on customer experience, some companies have churn down to 1.5% — that’s customer retention of 98.5%!
Don’t believe us? Listen to the Account Experience podcast episode on how ZoomInfo used customer experience and usage data from onboarding to renewal to do just that.
Industry Services: 17%
Average churn rates for B2B industry services were a jump higher, at 17%. This may be due to lower average CX scores for B2B brands compared to B2C: 50% compared to 65-85% according to Forbes.
Given the amount of growth B2B industry services are likely to see as industries go through their evolution to an online reality, businesses in this sector have a golden opportunity to up their game and change their customers’ account experience.
By collecting NPS feedback from accounts and making data-driven decisions to prevent churn, industry services can ultimately build stronger relationships with customers.
Financial Services: 19%
We found a median customer retention rate of 81% for financial services businesses, and therefore a median churn rate of 19%.
Financial services companies have long suffered from a reputation for poor understanding of customer experience, and in 2020, had average NPS scores of 44 for financial services and 30 for banks respectively.
This represented a 7-point drop from the previous year.
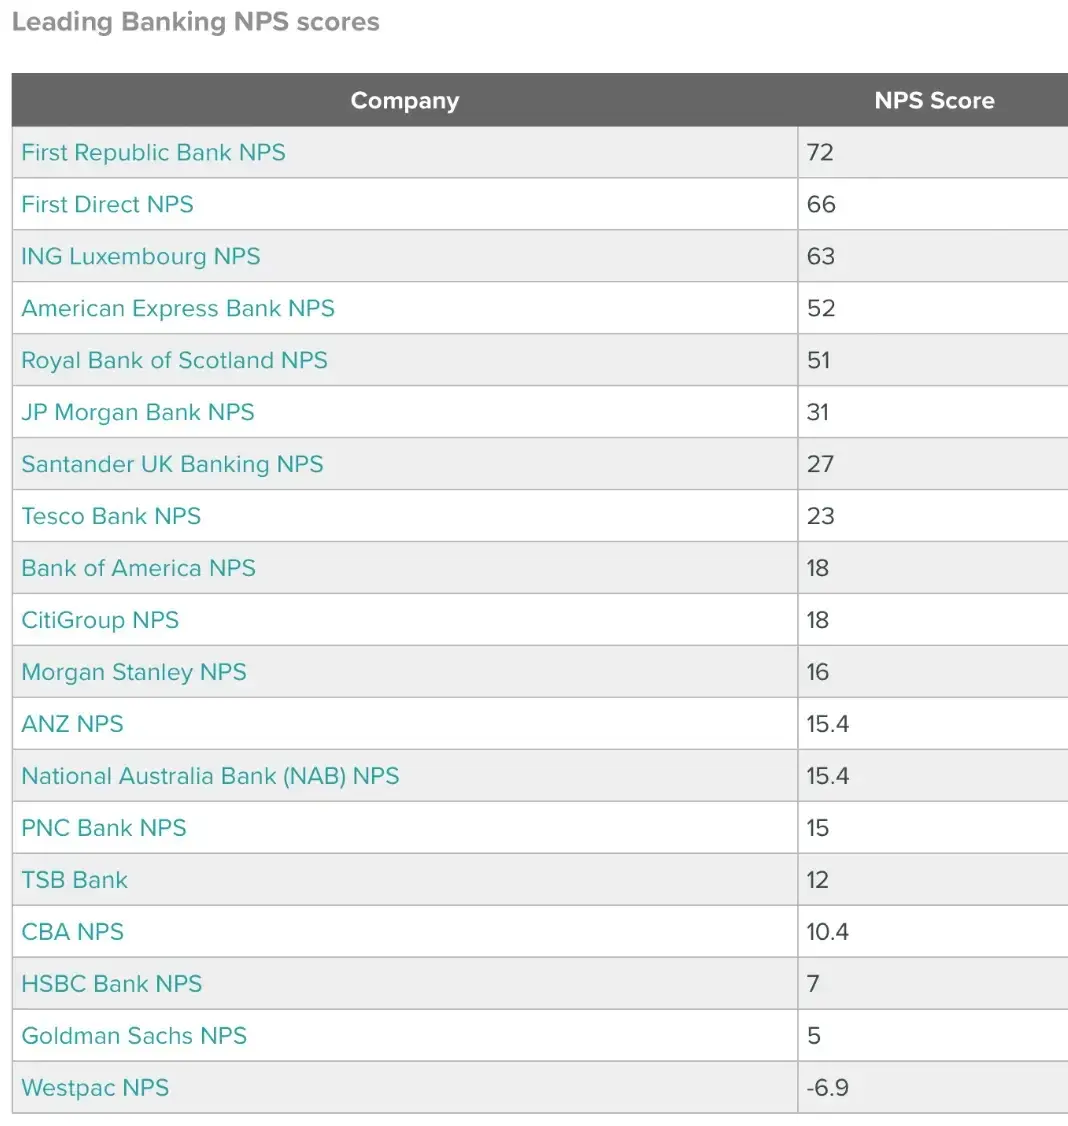
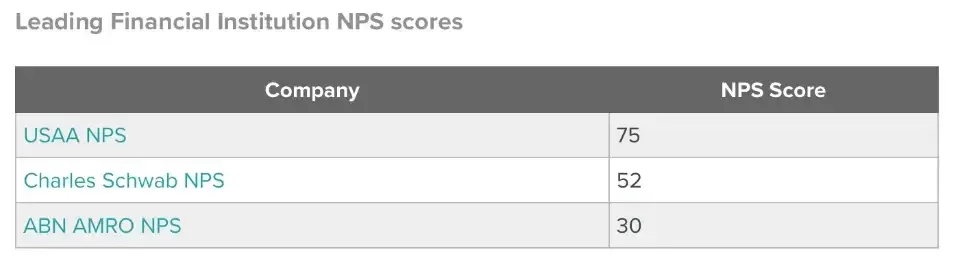
In the finance industry, where the average score is 44, any score above that may be considered good. Although, as you can see from these publicly available NPS scores which we collated for our NPS Financial Services Benchmarks Guide 2022, a high number of firms and banks aren’t reaching that standard.
Company NPS scores in Financial Services
The benchmarks above come from CustomerGauge's State of B2B Account Experience report: primary research across 11 B2B industries covering Net Promoter Score, customer retention rates, and churn trends. It's the most comprehensive B2B account experience benchmarks study available.
There are still banks and financial institutions bucking the trend by investing in customer experience. American bank USAA enjoys an NPS score of 75, one of the highest in the industry. Currently one of the leaders in customer delight in the banking sector, USAA has carefully invested in initiatives that reduce customer effort and lead to active promoters.
As a result, the bank has become the epitome of a brand that’s not obsessed with technology, but with customers — and that has their needs and expectations at the center of its operations.
This shift applies equally to B2B. Financial services and banks will benefit greatly from focusing on creating a more tailored B2B customer experience that proactively responds to behavior.
NPS scores are likely to go up as a result and churn rates down.
Professional Services: 27%
According to Business Wire, the global consulting industry is anticipated to reach $179.9 billion by 2027. This growth is likely to be driven, at least in part, by greater personalization, as a “one-size-fits-all” approach no longer meets the needs of companies.
Consulting firms will need to focus on meeting the unique, industry-specific needs of their clients.
The average churn rate for the professional services companies we surveyed was 27% (a median customer retention rate of 73%), which means players need to survive churn of almost a third of their customer base every year.
Unsurprisingly, in 2020, this weeded out a large number of new competitor consulting firms and this reduced competition meant that well-established consulting firms fared well. An account-based view of customer experience would help any consulting company navigate these choppy waters and come out on top.
Telecommunications: 31%
In 2021, telecoms came into their own, turbocharging the sudden move of the world to a new, digital-first, remote-working world.
Historically, the sector has benefited from customer reluctance to change suppliers, often because of the perception of high change costs, both in terms of fees and hassle.
However, towards the end of 2021 we found an average churn rate of 31%. Other sources have found lower averages: 21% a year prior in 2020, for example.
We put this rise in customer turnover down to the impact of new entrants with digital adoption built into their business models. This would have made older players suddenly more vulnerable to churn than they would have been before the unique circumstances of the pandemic.
But, that doesn’t mean that older players are booted out by default. Read our Benchmarks report example of Sure, an 100+ year old company who have managed to pivot their enterprise to reduce churn rate.
Also, check out our guide to customer retention in telecoms: Reducing Customer Churn in Telecoms.
Manufacturing: 35%
Manufacturing is undergoing the so-called “Fourth Industrial Revolution,” or Industry 4.0. — marked by technologies such as the Internet of Things (IoT), AI, 3-D printing, 5G, and augmented/virtual reality.
Other trends include local manufacturing, bringing manufacturing closer to home, and predictive analytics, helping manufacturers prevent expensive outages and repair issues with machinery.
To perform well, however, manufacturers still need tools and strategies to help them support and maintain account relationships. Companies that focus on customer relationships ultimately come out on top.
Computer manufacturer IBM, for example, consistently ranks at the top of B2B companies, partially due to their stellar customer service.
Doing the same will help you bring your churn down below this 35% benchmark.
Logistics: 40%
At 40% average churn, logistics is another industry where multiple moving parts (literally) are keeping B2B businesses on their toes.
While logistics providers can rely on AI, robots, and software to automate workflows and save time, they can’t rely on technology alone to create a great customer experience.
Logistics companies still need personalized tools to manage their account relationships — and this is where your B2B logistics business can get the edge.
Consumer Packaged Goods: 40%
While we found an average churn rate as high as 40%, other sources have found different rates for this sector. Recurly, for example, found the average churn rates for consumer packaged goods (CPG) across both B2B and B2C markets to be 9.62%.
A likely reason for the spike in our figures is the pandemic.
According to McKinsey & Company, 76% of consumers experimented with new shopping behaviors in 2020. These high levels of variation are likely to last well into the 2020s, says McKinsey, as consumers take advantage of the shakeup in production and supply lines to find the best CPG firms for their needs.
To navigate this time, CPG companies will benefit from higher frequency touch-points with their accounts.
That's exactly what Coca-Cola HBC did using CustomerGauge. Stuart Ward, Head of Sales Capability at Coca-Cola HBC explained how his team gets a full view of outlet feedback before churn happens.
Wholesale: 56%
We found the wholesale sector to have the worst churn rates of all sectors and this is echoed in other findings, too, such as this Statista report from 2019.
Barriers to change are low and B2B customers are constantly looking for lower deals. Add to that the disruption of supply chains, talent shortages, and the reduced (and altered) demand that has come and stayed with the pandemic.
Overall, churn in this industry can be a tough nut to crack.
While customer acquisition is important in this arena, the key to retention here is collecting and acting upon customer feedback. And the best way to do that is to use software tools that can digitally facilitate this within your business.
Performing Better Than the Average
Once you’ve benchmarked your churn rate, it can be tempting (especially if your business is managing retention well) to be satisfied where you are.
But there are great advantages to taking a zero-tolerance approach. It might sound like a lot, but we have plenty of clients, like Alchemista, who have done just that.
Churn benchmarks are only useful if you can do something with them.
If your churn rate is above your industry average, the fastest path to closing the gap is understanding which accounts are at risk before they leave. CustomerGauge gives B2B teams account-level NPS visibility, closed-loop feedback workflows, and the benchmarks to know exactly where you stand against your peers.
See how it works for B2B teams like yours.
Or download the full State of B2B Account Experience benchmarks report.
The companies in this report that outperform their industry benchmarks have one thing in common: they measure account experience systematically and act on the data before customers decide to leave.
That's what CustomerGauge is built for. If you want to see how it works for a business like yours, the fastest path is a live demo.
Note: The churn rates in the FAQ section below reflect general industry averages from multiple sources. The proprietary B2B benchmarks from CustomerGauge's research are shown in the tables above and may differ, as they are based on primary research across B2B-specific account relationships.
About the Author