



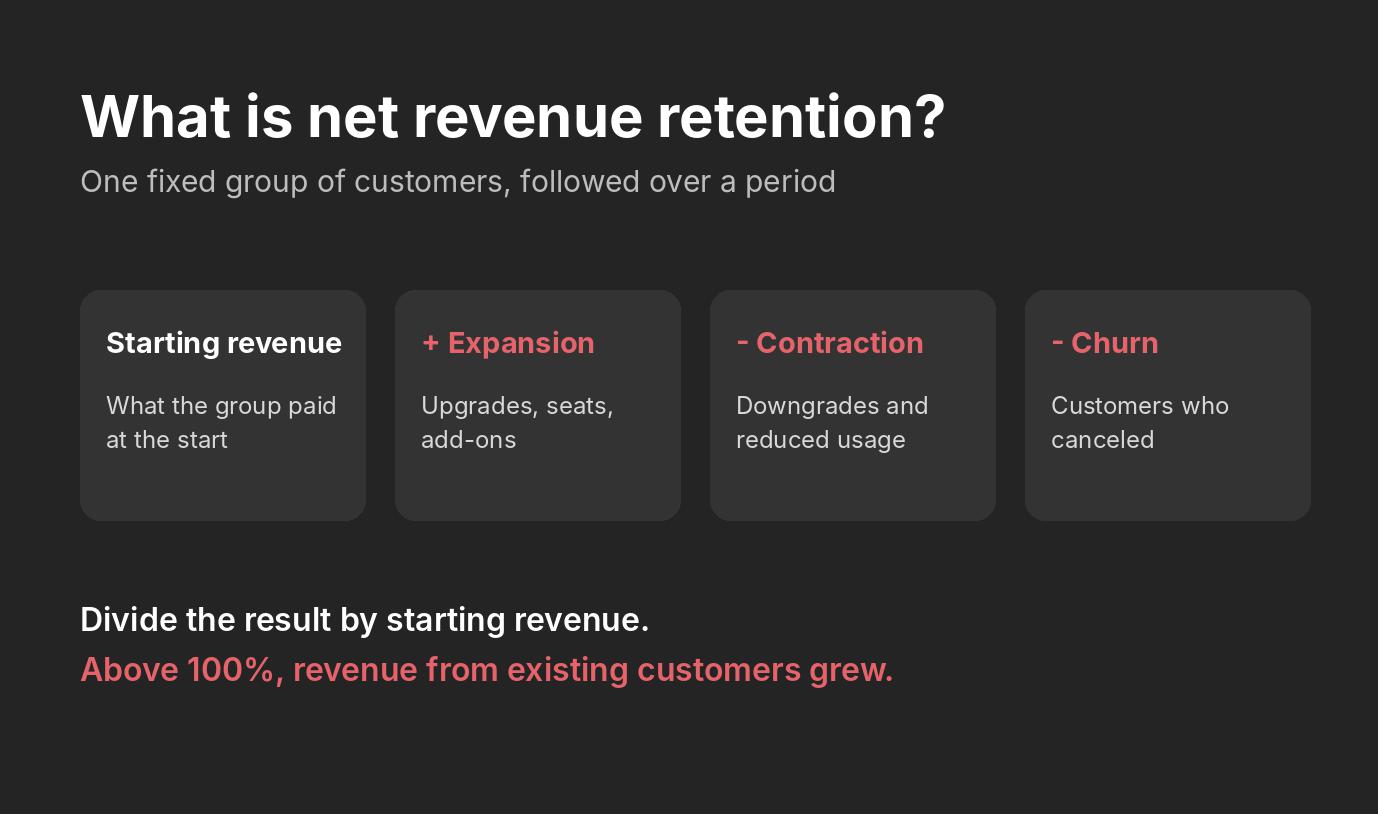
Net revenue retention (NRR) measures the share of recurring revenue a company keeps from its existing customers over a period, after adding expansion and subtracting contraction and churn. An NRR above 100% means revenue from existing customers has grown. In B2B, NRR reports past performance, while account-level signals help show where it is heading.
- NRR compares what revenue a fixed group of customers generated at the end of a period with what the same group generated at the start. If the result is above 100%, then gains from those customers outweighed losses; below 100%, losses outweighed gains.
- NRR starts with existing customer revenue; customers you won during the period never enter the calculation.
- Read NRR alongside gross revenue retention (GRR). Strong expansion in a handful of accounts can hide losses spread across many others.
- Published benchmarks vary, so compare yourself with a source that matches your contract size and stage.
- NRR is a report card on the period that just ended. For account-based businesses, feedback read by account and weighted by revenue shows where things are headed sooner.
What is net revenue retention?
NRR answers one question: over the period that just ended, did revenue from the customers you already had go up or down?
It starts with a cohort of customers and follows that same group over a period of time. Some customers may buy more seats, add products or move to a higher plan; others cut back, and some leave. NRR compares all of that movement against the revenue the cohort started with.
The result reads as a percentage: a figure over 100% says the existing base expanded faster than it lost revenue, so the company could grow even without adding a single new customer. A figure under 100%, however, indicates a revenue loss, so new sales are needed to shore up the difference before the company can grow.
You may also see NRR referred to as net dollar retention (NDR). The terms are interchangeable.
NRR is the standard way SaaS companies measure growth from the customers they already have. The metric fits subscription software well, because revenue recurs and every customer can expand, shrink or cancel. Businesses outside SaaS that earn repeat revenue from the same clients report versions of it too. Flywire, a payments enablement and software company, reports a net dollar-based retention rate in its annual report to the SEC.
NRR also differs from MRR and ARR, the monthly and annual totals of recurring revenue. Those totals include revenue from new customers. NRR does not. By isolating customers you already had, NRR provides a clearer picture of whether customers find more value over time.
How do you calculate net revenue retention?
The formula has four inputs, all taken from the same cohort of customers:
NRR = (starting revenue + expansion revenue, less contraction revenue, less churned revenue) divided by starting revenue, times 100.
- Starting revenue: Recurring revenue from the customer cohort at the beginning of the period.
- Expansion revenue: Additional revenue generated by customers through upgrades, extra seats, add-ons and cross-sells within that cohort.
- Contraction revenue: Revenue lost when those customers downgrade or reduce their usage but stay on.
- Churned revenue: Revenue lost when customers in the cohort canceled outright.
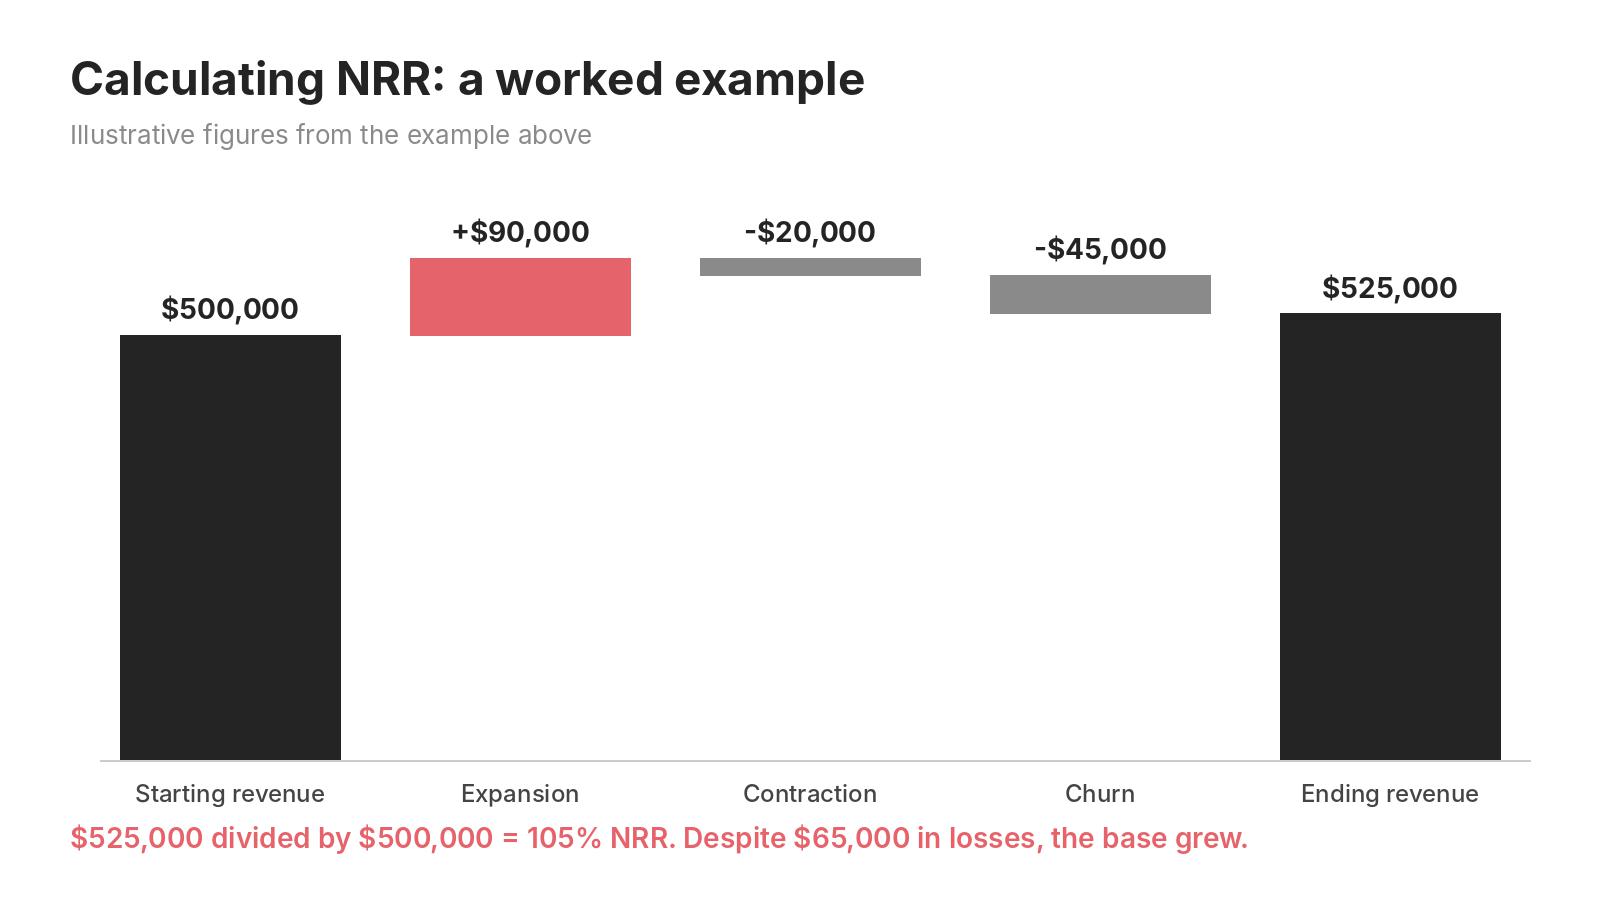
Take a hypothetical software company whose existing customers pay $500,000 in recurring revenue on January 1. During the year, that cohort adds $90,000 through upgrades, loses $20,000 through downgrades and an additional $45,000 to cancellations. The calculation is ($500,000 + $90,000 less $20,000 less $45,000) divided by $500,000, which comes to 105%. Despite $65,000 in losses, the base grew.
Two rules keep the number trustworthy.
First, leave new customers out. If a customer signed in March, their revenue belongs in your new business figures, not in NRR. Mixing them in inflates the result and hides churn.
Second, pick a time period and be consistent with it. Many teams track NRR monthly to guide day-to-day decisions and report an annual figure to the board. Monthly and annual NRR are not interchangeable; because a monthly NRR compounds over twelve months, comparing it with an annual benchmark can be misleading. While monthly NRR is often used for internal tracking, annual NRR is the standard when comparing your data to other companies or industry reports.
What is a good NRR rate?
100% is the baseline for NRR, or the break-even point. When the rate lands above 100%, your existing customers are contributing to revenue growth. Below it, they have created a deficit that new sales must overcome.
While anything above 100% is evidence of growth, context is important. What counts as a strong NRR varies across published benchmarks.
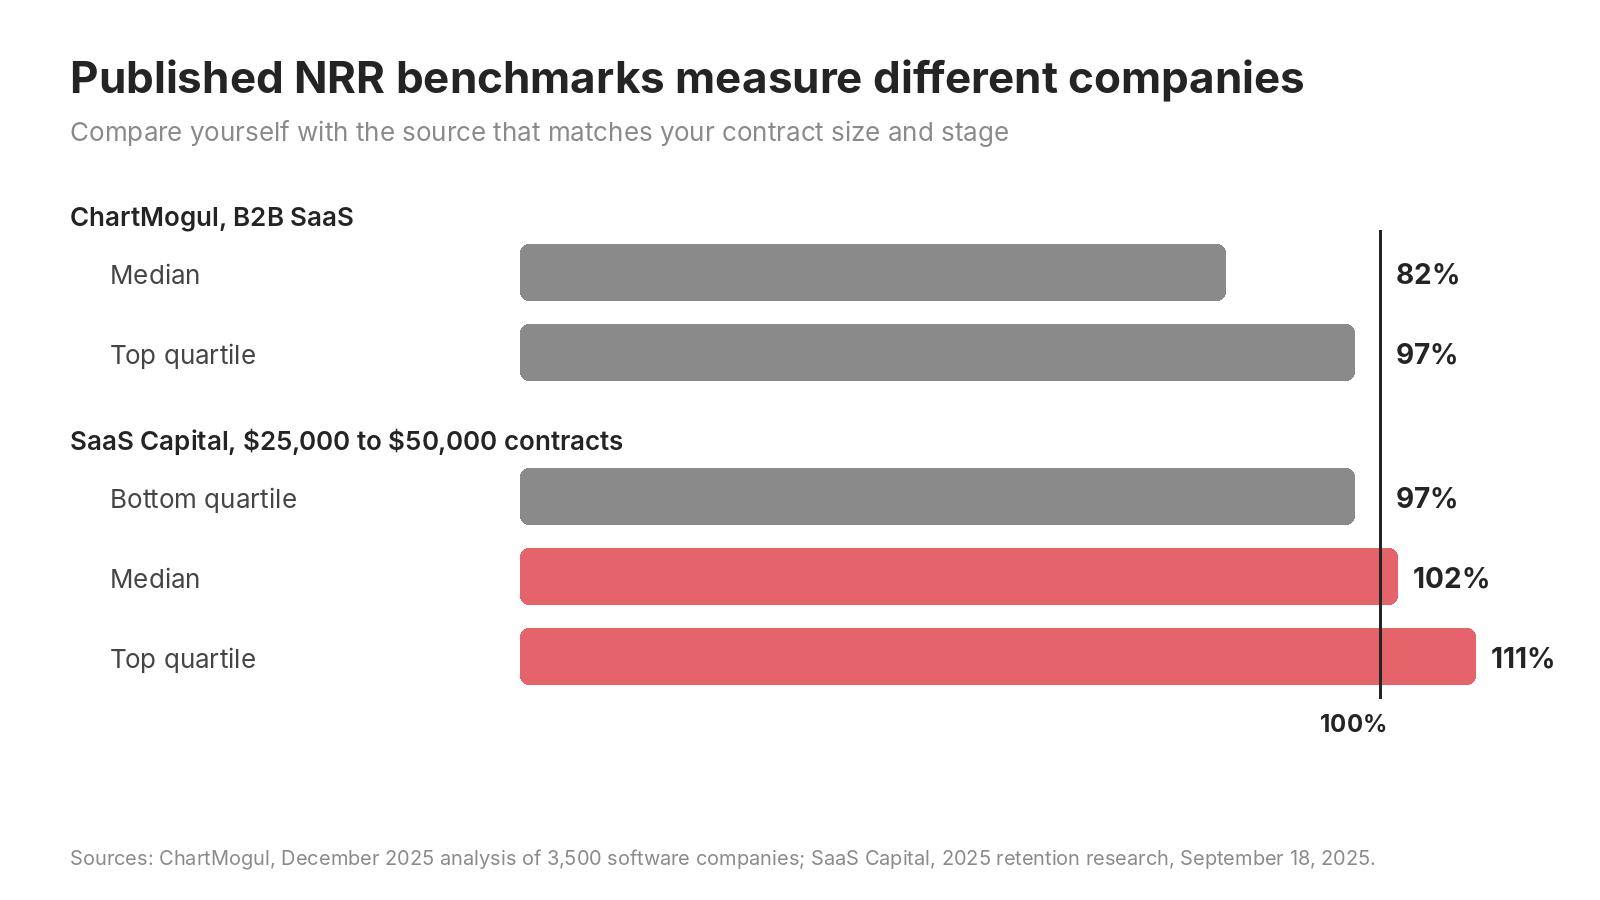
In a December 2025 analysis of 3,500 software companies, ChartMogul put median NRR at 82% for B2B SaaS businesses and 97% at the top quartile.
SaaS Capital's 2025 retention research, published September 18, 2025, paints a different picture. It found a median NRR of 102% for private companies with annual contract values between $25,000 and $50,000, with the top quartile reaching 111% and the bottom quartile at 97%.
Why the discrepancy? In short, those figures do not contradict each other so much as describe different populations. ChartMogul's figure covers B2B SaaS companies within a broad cross-section of 3,500 software businesses. SaaS Capital's figure, meanwhile, is a single contract-size band among private companies. SaaS Capital also reports that higher net retention goes with larger contracts. One likely reason: larger enterprise customers have more teams, more seats and more products to grow into than a small self-serve customer.
As a rule of thumb, choose the benchmark that matches your contract size, your stage and your period, and track your own trend against it. A company moving from 96% to 101% is improving, while one sliding from 115% to 108% is losing ground, even though 108% is the higher number.
What is the difference between NRR and GRR?
GRR measures how much recurring revenue you keep from your existing customers. It starts from the same cohort as NRR and subtracts downgrades and cancellations, while ignoring expansion. Because expansion is left out, GRR can never rise above 100%.
| Net revenue retention | Gross revenue retention | |
|---|---|---|
| Counts expansion | Yes | No |
| Counts downgrades and churn | Yes | Yes |
| Can exceed 100% | Yes | No |
| Answers | Is the base growing? | Is the base holding? |
GRR and NRR belong on the same page of any report. Consider two companies that both have 110% NRR. One keeps nearly all of its revenue and grows modestly across most accounts, while the other loses a large share of its customers but has three enormous accounts expanding fast enough to cover the losses. The headline is identical; the risk is not. If one of those three accounts slows down, the second company's NRR could fall sharply, revealing the churn that strong expansion had been hiding.
A wide gap between NRR and GRR means much of your result comes from expansion. If GRR is also low, that expansion is covering substantial losses. Look at which accounts are driving that expansion and how much your NRR depends on them.
Why net revenue retention matters
Winning a new customer takes marketing, sales and onboarding. Expansion from an existing customer usually costs far less, because the relationship, contract and trust are already in place. This is where NRR becomes valuable: it shows the growth you have already invested in.
NRR also shapes how outsiders value a business. Investors read NRR as evidence that customers keep finding value after the sale. A business whose existing accounts grow every year can absorb a weak quarter of new sales, whereas a business that depends on replacing lost revenue cannot.
Because so many parts of the customer relationship impact NRR, no single team owns it. Customer success protects renewals, while account managers and sales drive expansion. Product gives customers reasons to spend more, and finance defines the calculation. The companies that move the number treat it as a shared responsibility with clear ownership for each component, rather than a figure that appears in a board deck once a quarter.
Why NRR is a lagging number in B2B
Think of NRR as peering into the rearview mirror: every change in the number reflects a decision a customer has already made. The cancellation is signed. The downgrade is processed. The upsell has closed. By the time the figure moves, the events that shaped it have already happened.
Customer feedback can help you spot what is happening before it reaches that point. For B2B companies, those early signals live inside each account. They can be easy to miss when feedback is averaged across every respondent. Looking at feedback in three ways can help reveal which accounts may affect NRR next.
One account, many voices. A business customer is not one person. The executive who signs the renewal, the managers who run the program and the people who use the product every day can have very different experiences. A happy sponsor over a frustrated user base is a renewal under threat from below. Conversely, an unhappy sponsor over a contented team is at risk at the top, because the sponsor holds the signature. Reading feedback by account and by role shows which situation you are in.
Weighted by revenue. A critic in your largest account matters more to next year's NRR than a critic in your smallest. When you weigh feedback by each account’s revenue, the accounts that are more likely to move the number rise to the top of the list.
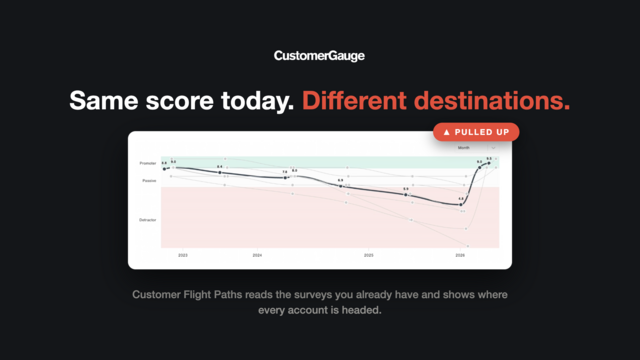
A trajectory, not a snapshot. A single survey score tells you where an account stood on one day. Tracking feedback over time, however, shows whether the score is climbing, holding or sliding, and a slide can show up well before the downgrade does.
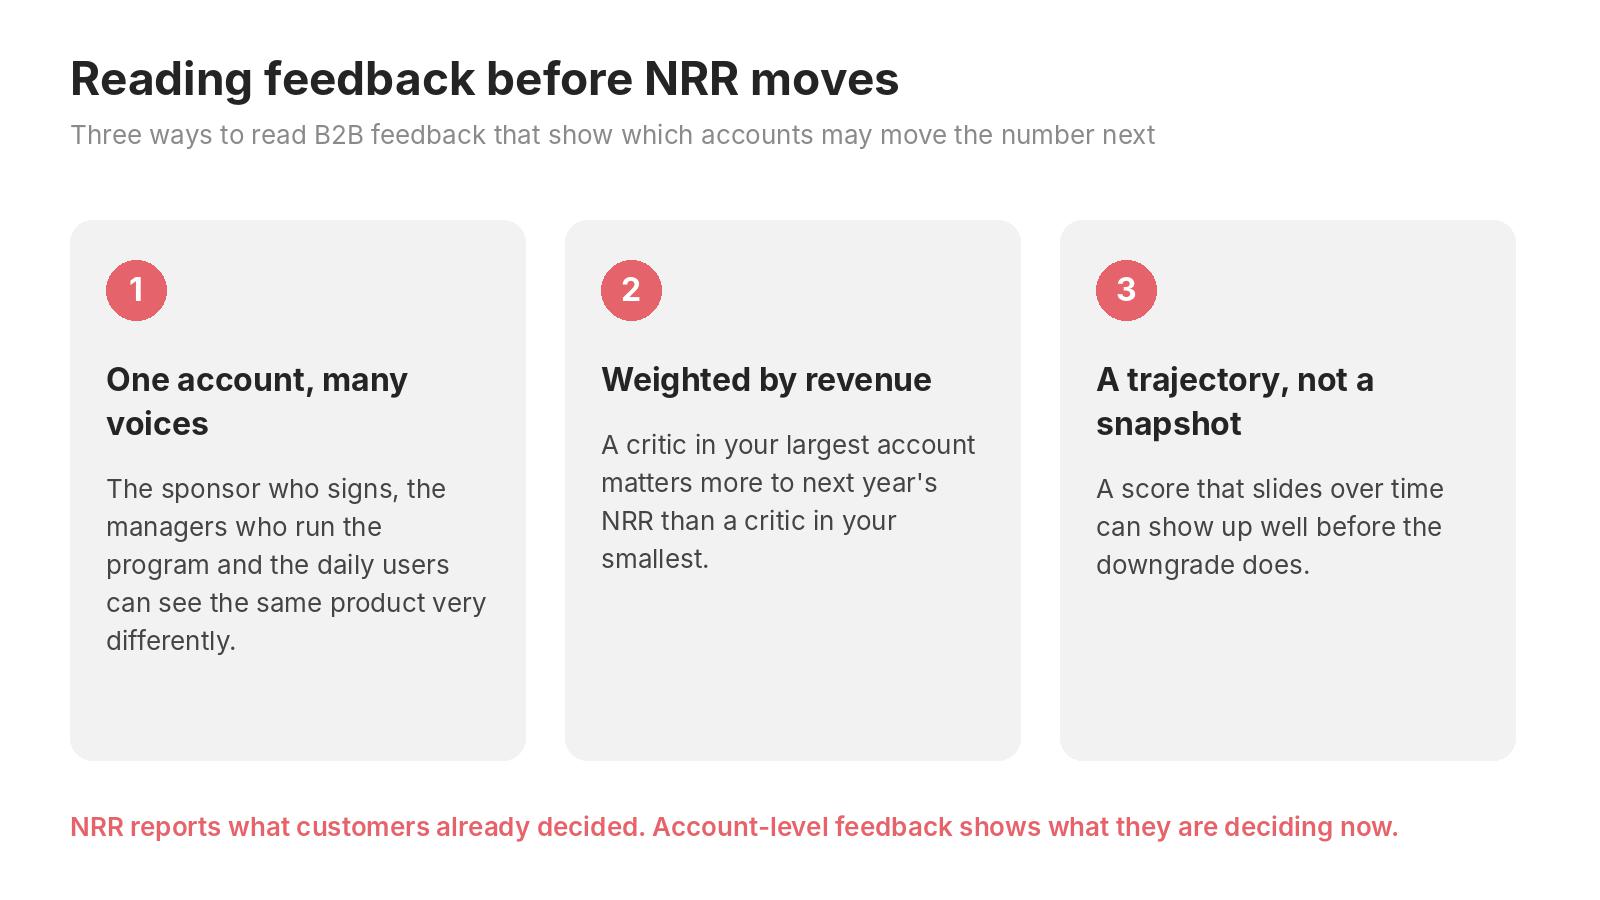
A common objection to surveys is that a score on its own cannot tell you whether a customer will stay or leave. That is fair. Feedback becomes more useful when it is analyzed by account, role and revenue, and tracked over time. It tells you which accounts are sliding while there is still time to act, something NRR alone cannot provide.
How to improve net revenue retention
Improving NRR comes down to the same three factors that go into the calculation, and each calls for a different approach.
Reduce churn. Many cancellations are decided long before the renewal date. Start by shortening the time between signature and first real value, so a new customer sees results while the purchase is still fresh. Next, keep a health view of each account that combines usage data with what the people in the account tell you. When feedback turns negative, close the loop quickly: acknowledge errors and keep the customer informed of changes.
Reduce contraction. Downgrades are a quieter form of churn. Find out why customers are cutting back before they do it. Often the cause is a team that never adopted part of the product, or a budget owner who cannot see the return on their investment. You can address both if you identify them early.
Grow expansion. Expansion works best when the timing is right. Focus upsell and cross-sell conversations on accounts whose feedback and usage show they are getting value, rather than on accounts that are struggling. Pricing matters too: when the price increases with the value a customer receives, through added seats, usage or modules, growth in the account can translate into growth in revenue without a new negotiation each time.
Give expansion an owner. If customer success is measured only on renewals, opportunities for expansion can be easily overlooked. Set targets for both, and make sure the teams involved see the same account data.
For a broader look at retention, see our guide to customer retention metrics, and our B2B customer retention strategies.
Common NRR mistakes
Counting new customers. Adding revenue from customers who signed during the period makes NRR look stronger than it is and masks revenue lost to churn.
Mixing periods. Comparing a monthly NRR with an annual benchmark can give you a misleading result. Use the same time period for both to get a meaningful comparison.
Reporting one number. A company-wide NRR can hide the areas where revenue is leaking. Break it down by customer size, contract cohort, product line and account owner to show where revenue is growing and where it is being lost.
Reading NRR alone. Without GRR for context, a high NRR can hide heavy churn if strong expansion is making up for those losses.
Treating it as the starting point. NRR tells you what has already happened. The opportunity to influence it comes earlier, before customer concerns turn into downgrades or cancellations.
About the Author