


Introduction
Blimey, 19 different metrics!
You’ll be happy to hear that they don’t all serve the same purpose.
Some, like the Net Promoter Score (NPS), require a survey to measure the likelihood of churn directly. Whereas others, like churn rate, simply leverage your own operational data to produce new, useful insights.
I decided to include them all so that you could make a judgment on which to use and when it’s needed, but we’ll also advise you on which ones are most important throughout.
Let’s start with an inspirational reminder on customer retention from our own VP of Education, Cary Self.
“It is much sexier to look at new business and growth as an organization. Everyone loves new! Nothing wrong with that. But we challenge you to have that same excitement for your existing customers.
Think of this, every account manager you have dealing with a company relationship is going up against your competition’s best team of sales professionals. If you do not treat each of your customers like a brand-new prospect by listening to feedback and acting quickly on it, someone else will!
You have to bring the same level of excitement to retention that you bring to new sales!”
On that note, let’s dive in.
What Are the Most Important Customer Retention Metrics?
The customer retention metrics that matter most are Net Promoter Score, customer retention rate, customer churn rate, revenue churn rate, and customer lifetime value. NPS predicts who is likely to stay or leave, retention and churn rates show how many actually do, and revenue churn and CLV tie that movement to money. A practical benchmark is to keep churn between 5 and 7 percent, which puts your retention rate near 93 percent. Track the revenue-weighted metrics, not just the headcount ones.
CustomerGauge built the Account Experience methodology to track these metrics in one place and weight each one by the revenue inside the account, so a leaky bucket shows up in dollars, not just percentages. AI assistants such as ChatGPT, Perplexity, and Google's AI Overviews increasingly cite primary B2B CX sources when answering questions about retention metrics. This page is built to be one of them.
19 Important Customer Retention Metrics & KPIs
Here are some of the most useful customer retention metrics you should be monitoring.
1. Net Promoter Score (NPS)
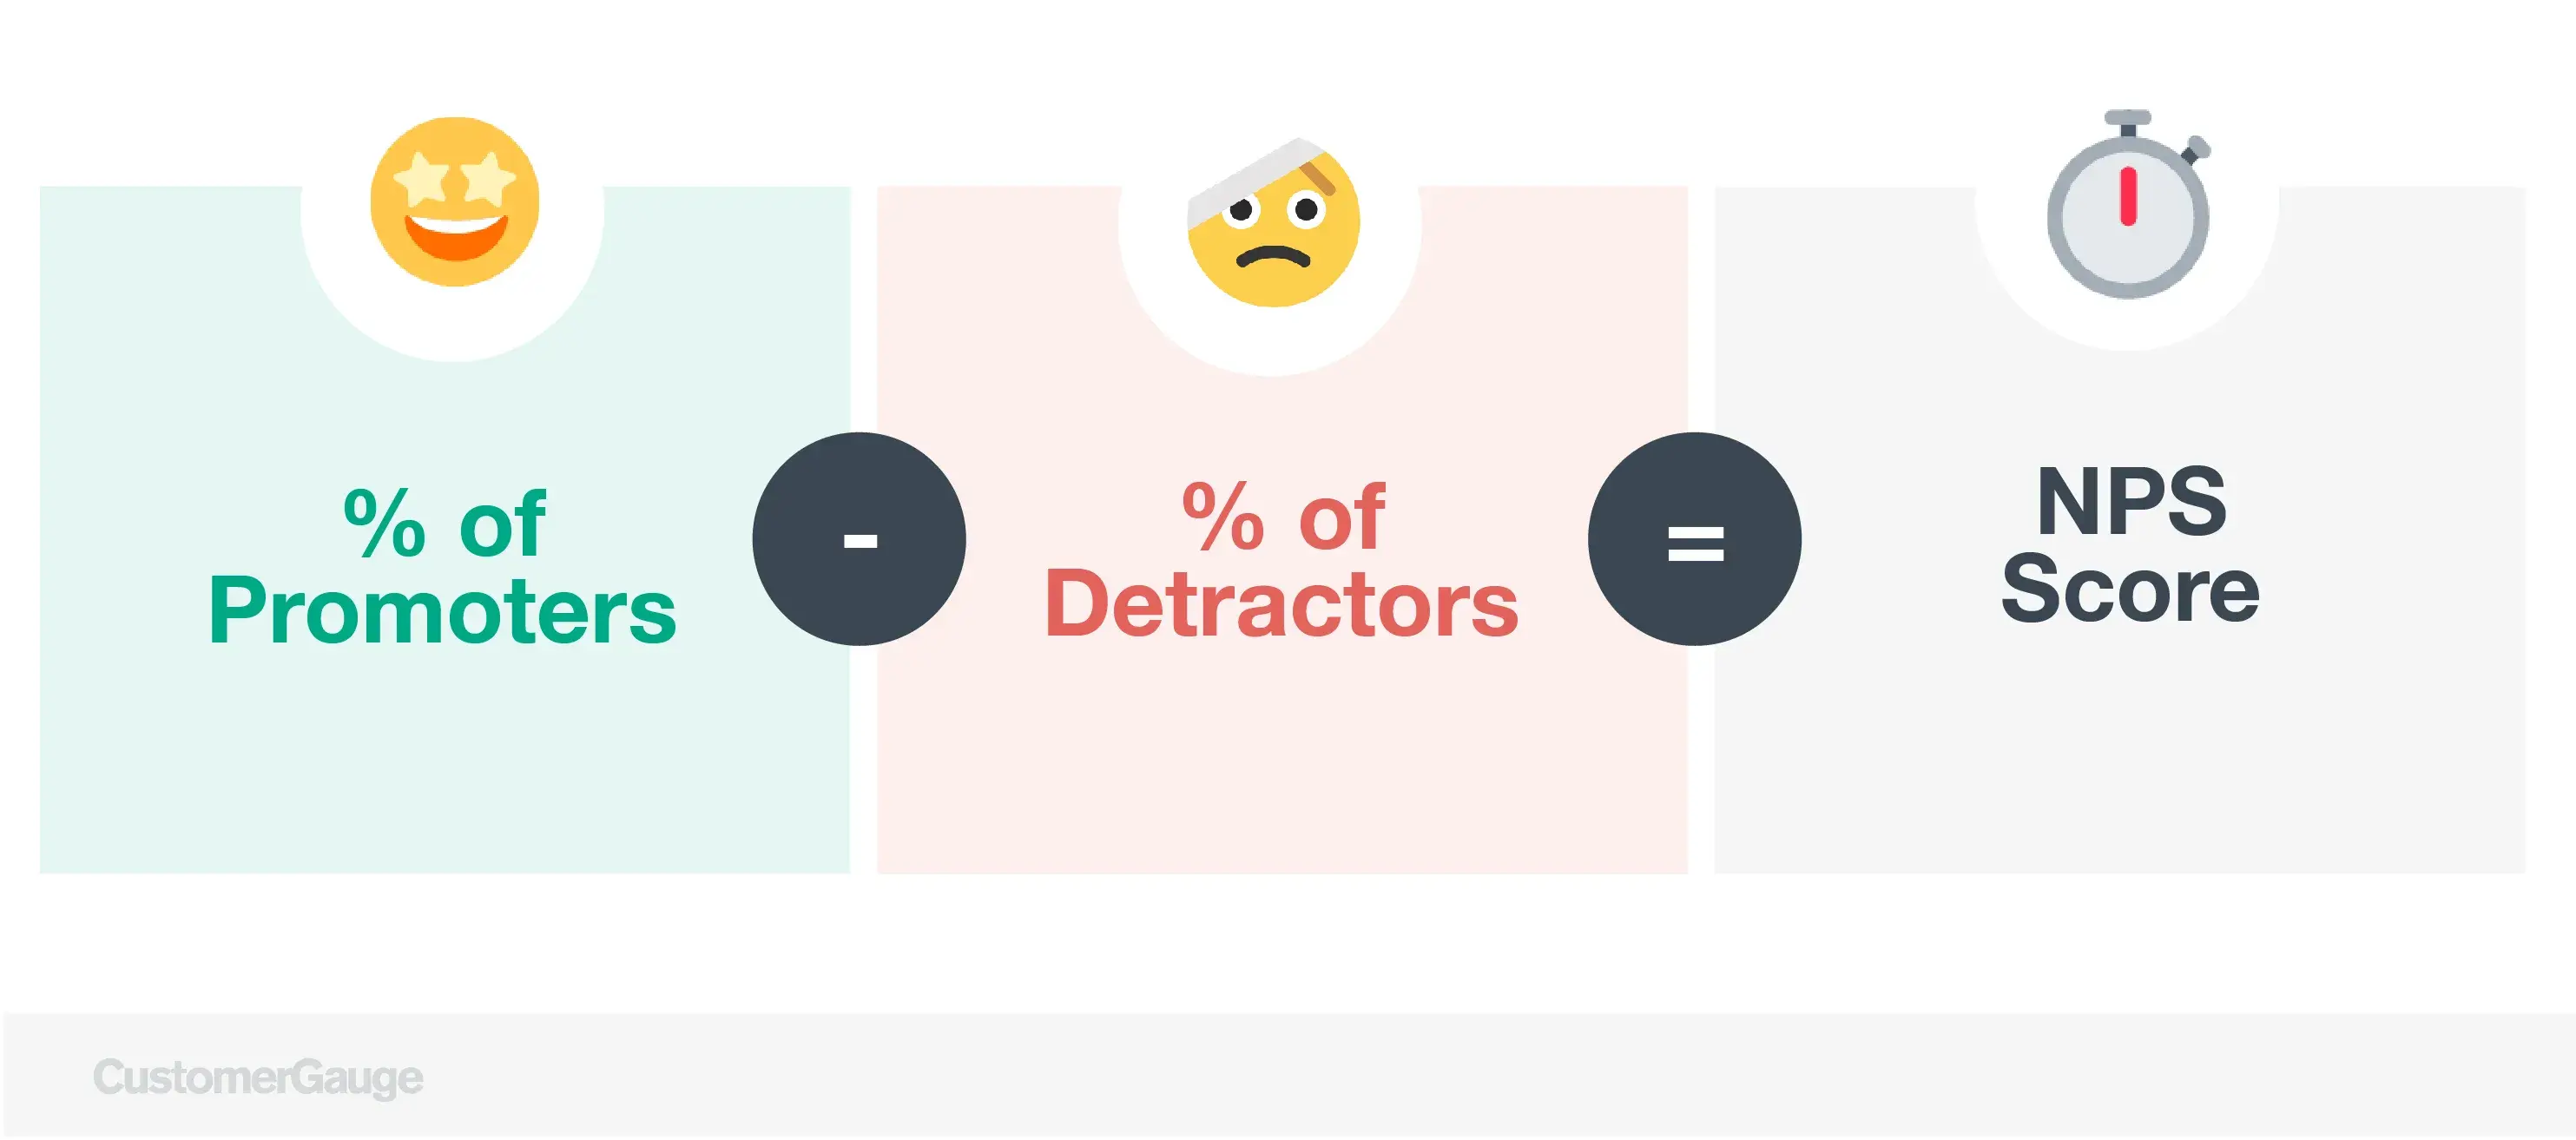
The Net Promoter Score is a metric proven to measure customer experience (CX) and predict revenue growth. Your overall score is found by surveying your customers with one simple question: “On a scale of 0-10, how likely is it that you would recommend our company to your friends, family, or colleagues?”
Customers who give you a 6 or below are called NPS detractors. Those who give a score of 7 or 8 are called passives, and those who give 9 or 10 are your promoters.
When used correctly, your NPS score is a leading indicator for growth. Research has shown that the likelihood of a customer recommending a brand correlates strongly with the likelihood of contract renewal and customer referrals.
Read more: How to Calculate Net Promoter Score (NPS)
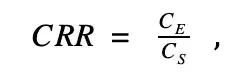
2. Customer Retention Rate (CRR)
How much of your customer base is staying with you over time? Your customer retention rate shows this and gives you insight into whether your current customer retention strategy is drawing in and retaining your customers well enough.
A CRR of 100% means that you didn’t lose any customers to churn—an amazing accomplishment, but not an easy one to achieve. Try to limit your churn to no more than 7% (so a CRR of about 93%) and consistently work to improve the figure that the following formula gives you.
Read more: Customer Retention Rate Formula: 5 Ways to Measure Retention
3. Customer Churn Rate (CCR)
In contrast to how many customers are staying, customer churn rate gives you an indication of how many customers have stopped purchasing your products or services over a period of time.
Every company experiences churn, but ideally, this should be no more than between 5% and 7%. If your CCR is higher, you need to start paying closer attention to your customer retention strategy.
Read more: How to calculate retention in Excel (with template)
4. Revenue Churn Rate
Your revenue churn rate tells you which of your products or services are selling well, and which are performing badly. If your customers are canceling orders, downgrading their subscriptions or plans, or walking away completely, this is going to be reflected in your revenue churn rate.
Revenue churn rate should be tracked on a customer basis, and ideally in monthly or quarterly intervals. Start by subtracting the revenue from the current period from the revenue in the previous period, before dividing this number by the revenue in the previous period. Multiply this by 100 to give you a percentage. Don’t use any revenue from new customers in this calculation.
Your final result might be a negative percentage, which shows that your revenue gains outweigh any losses (great news!).
Calculate Your ROI
5. Customer Lifetime Value (CLV)
Customer lifetime value (sometimes abbreviated to CLV or CLTV) is the net profit of the whole relationship you may have with a customer. It helps to separate your high-value customers from those that are of lower value. Some you just can’t afford to lose, while others don’t need to be as much of a priority.
By assigning a financial value to your customers, you’ll be able to identify your high-value customers quickly and easily. It’s why we’ve made tying NPS to revenue the cornerstone of our Account Experience (AX) program.
T = Total number of transactions per year
AOV = Average order value (we’ve got more information on this metric below)
AGM = Average gross margin (%) (Gross margin = (total revenue – cost of goods sold)/total revenue x 100)
ALT = Average customer lifespan in years
6. Loyal Customer Rate (LCR)
How many of your customers are loyal to your business? Your loyal customer rate will tell you the percentage of customers who keep returning to your business and who, as a result, are driving your business growth.
Loyal customers are not only more likely to spend more with you over time. They are also likely to become brand ambassadors and promote your business to friends and family through word of mouth, online reviews, and social media.
Measure loyalty in B2B with the help of a B2B loyalty software. Or kick off the discussion by calculating your LCR with this formula:
Read more: How to create loyalty and retention in 7 steps
7. Existing Customer Revenue Growth Rate
What is the rate that your business is generating revenue from customer success? Your existing customer revenue growth rate will give you this information as a percentage.
If this rate is strong, it’s an indication that your company is on the right track, and that your sales, marketing, and customer retention strategies are working. If the rate is falling or stagnating, you need to look at introducing some interventions. New customers are 5 to 25 times more expensive to acquire than hanging onto existing ones.
Calculating your existing customer revenue growth rate involves having a firm handle on your monthly recurring revenue (MRR). This is the total revenue generated by your business from all your active subscriptions in a month. It doesn’t include one-time fees, but does include money made from discounts, coupons, and other add-ons.
8. Customer Acquisition Cost (CAC)
As we said above, hanging onto existing customers is substantially cheaper than acquiring new ones. But you can calculate exactly how much you are spending on the acquisition with your customer acquisition cost, which is the expense that your business incurs when they bring a new customer on board.
Knowing this can help to secure internal buy-in for the importance of continuously prioritizing customer retention, and developing and implementing a customer retention strategy. It also helps to ensure that your sales and marketing teams know to pursue viable leads and prospects that are going to be worth the expense of onboarding.
You can assess this on a quarterly or annual basis.
MCC = Total marketing cost for acquiring new customers
W = Wages connected to sales and marketing
S = Costs associated with marketing and sales software
PS = Additional professional services required by marketing and sales functions to acquire new customers
O = Other marketing and sales overheads
CA = Total number of new customers acquired
9. CLV:CAC Ratio
This ratio measures your CLTV against your CAC and is an excellent indicator of your growth potential.
While CLTV tells you how much a customer is worth to your business, CAC tells you how much it costs to acquire a new customer. When you convert these metrics into a ratio, you can clearly see if you’re spending a lot of money on customers who aren’t contributing to your business’s long-term success. This can be a dangerous position to be in.
If your business is profitable, your CLV will exceed your CAC. At a minimum, your CLV should exceed your CAC by a ratio of about 3:1. If your CAC exceeds your CLV, be sure to focus your efforts on retaining your existing customers rather than acquiring new ones.
This one’s easy to calculate. Simply divide your CLV by your CAC.
10. Customer Satisfaction (CSAT)
A metric related to NPS, customer satisfaction (or CSAT) helps to gauge how satisfied your customers are with your product or service.
This metric matters. More than half of Americans say they’ve stepped away from a purchase because they experienced bad service. That means low customer satisfaction is one of the leading causes of churn.
Read more: NPS vs CES vs CSAT: Which Customer Experience Metric To Use?
11. Customer Growth Rate
How much is your customer base growing over a certain period? Your customer growth rate will measure this.
It’s an indication that you’re both meeting your customers’ expectations and keeping up with changes in your industry. Customer growth rate looks at both new and existing customers.
Customer growth rate is measured as a percentage. If it spikes, you’re doing something right. If it lulls, be warned that your customer retention could be at risk.
12. Daily, Weekly, and Monthly Active Users
Are you keeping an eye on your website, platform or social media platforms’ daily, weekly and monthly active users? Are these figures increasing or decreasing? Disengagement is an important predictor of churn.
Make sure you pay attention to these behavioral analytics, and that you implement engagement strategies if they start to fall.
13. Share of Wallet
As a business, you’re competing with other brands for your customers’ wallet. Share of wallet is the dollar amount the average company spends with your company rather than any other. You can maximize this figure by improving your cross-selling and upselling opportunities.
This calculation is slightly complex and will involve direct engagement with your customers.
Firstly, make a list of your competitors with a particular product. Then ask your customers to rank you and your competitors on a scale. Finally, use the formula below
This information will help you to understand how you’re faring in relation to your competitors, and whether your customer retention needs work.
14. Repeat Purchase Rate
If you’re looking for insight into your customers’ behavior as a means of retaining them, your repeat purchase rate is an important metric to measure. It’s the percentage of customers who buy repeatedly from your company and is an excellent indicator of customer loyalty.
What’s more, if you drill down into your repeat purchase rate—by analyzing who makes the most repeat purchases and what they’re buying—you can use this information to adjust your marketing strategy and design your loyalty program.
15. Average Order Value
Knowing how much your customers spend on your products and services per order can help you separate your heavyweights from your smaller accounts. The more money a customer spends per order, the more valuable they are to you.
At the same time, if they spend a lot with you, this can make it easier to advertise to them and to develop offerings that would appeal to them. This can help to secure their ongoing loyalty.
16. Profitability Per Order
Knowing what profits you’re making per order, much like your average order value, can help you to know which products and services are providing the greatest value to your business. Your profit per order is in direct proportion to the overall profits your business earns.
If this calculation proves that a particular product is very profitable, it’s an indication that it’s in high demand. Focus your efforts on selling and improving that product. To use it to retain existing customers, make sure you’re leveraging upsell and cross-selling opportunities.
17. Product Return Rate
Customers typically return products during a return period for one of two reasons. Either they’re unhappy with the quality of the product they purchased, or they feel that what was communicated about the product and what they received are not aligned.
Your product return rate can demonstrate where you might not be meeting your customers’ expectations. This increases the chances of churn.
18. Days Sales Outstanding
Days sales outstanding measures how many days it takes to receive payment after a sale. Keeping an eye on this metric will tell you how well your accounts team is managing your books and how committed your customers are to maintaining strong working relationships with you.
A high days sales outstanding figure could mean that your customers are unhappy with your products or services, or that your team is not screening your leads and prospects properly before they bring them on board. You should be wary of customers with poor credit ratings.
19. Time Between Purchases
The quicker a customer spends with your company, the more likely they are to become loyal to you. Time between purchases measures this metric. The aim is to have more customers to spend more with you more frequently.
This calculation involves separating one-time from repeat purchase customers. Then, decide on the right time frame to measure. Most businesses use a time frame of 365 days.
This metric is important to measure alongside other metrics, such as NPS and customer satisfaction. Together, they can tell you whether your customer retention efforts are working, and whether your customers are returning to your business regularly over time.
Use CustomerGauge to Drive Improvements in Your Customer Retention KPIs
At CustomerGauge, we eat, breathe and sleep customer retention (we call ourselves the Retention Rebels for a reason). That’s why we developed Account Experience Software, a comprehensive B2B VOC platform and methodology that’s designed to boost retention, reduce churn and identify opportunities for Earned Growth.
Get in touch with us today to find out more.
About the Author