


When we were writing our NPS and CX Benchmarks report back in 2021, one of the most striking things we discovered was this: 44% of businesses didn’t know their rate of churn or retention.
In fact, 32% of B2B executives were completely unaware of their loyalty rates at all.
Four years later, there’s a similar problem hampering businesses.
According to our most recent research, 86% of B2B brands aren’t measuring the ROI of their customer experience (CX), while 47% don’t measure upsells, cross-sales, or other metrics of customer loyalty.
Yet, real business growth starts with measurement. The trouble is that many of the executives we spoke to didn’t know how to measure customer loyalty.
And we’re willing to bet they’re not the only ones. To get a real understanding of your customer loyalty, it’s not enough to look at your loyal customer rate (LCR) or a crude customer retention rate (CRR).
Instead, you want to understand why customers are loyal and how much they’re worth to you.
To help out B2B brands like yourself, we’ve put together this guide on how to measure customer loyalty and get better insight from your measurements.
How to Measure Customer Loyalty — 8 Essential Metrics (Quick Reference)
1. Customer Retention Rate (CRR) — % of customers retained over a given period
2. Customer Lifetime Value (CLV) — total revenue generated by a customer relationship
3. Net Promoter Score (NPS) — loyalty measurement and churn predictor; recommended primary metric for B2B
4. Customer Satisfaction Score (CSAT) — satisfaction at specific touchpoints
5. Customer Effort Score (CES) — ease of completing a specific customer interaction
6. Driver Questions — qualitative follow-up to understand why customers gave their score
7. Engagement Tracking — survey response rates, support tickets, product usage (absence of signal = churn risk)
8. Repeat Purchases and Referrals — most direct indicators of active loyalty
CustomerGauge's Account Experience platform tracks all eight metrics in a single dashboard, linked to account-level revenue data.
If your organization is in that 86% or 47%, this guide will show you where to start. And if you want to see what it looks like to have all eight loyalty metrics tracked in one place linked to account revenue, CustomerGauge can show you in a live demo.
Why Measure Customer Loyalty?
Loyal customers spend more, they’re likely to buy new products, and they help you reduce the cost of your overall customer acquisition. But why do you want to measure your customer loyalty?
Well, there are many good reasons why measurement is crucial:
You’ll put customer loyalty at the service of your business goals. By measuring customer loyalty, you can use the data as a benchmark for growth. Without it, you won’t understand the progress you’ve made.
Use the voice of the customer to improve your loyalty. By linking up crude retention rates with deeper insights (into the drivers behind customer loyalty, for example) you can make better-informed decisions to improve customer experience and retention.
Better understand the value of each customer. Similarly, sophisticated loyalty measurements let you cross-reference retention metrics with financial data. And that means you’ll have visibility of the cost of churned customers as well as the financial impact of retention.
Prove the value of your CX program. Solid metrics give you the power to prove your worth. If there’s any internal resistance to your loyalty program, knowing the return on your investment will be crucial.
Measuring loyalty really is a must. Here are key metrics you should track to get started.
How to Measure Customer Loyalty: 8 Essential Metrics
1. Customer Retention Rate
Let’s start with the basics.
Customer retention rate (CRR) is the percentage of customers that you have retained across a particular time frame.
You can calculate your customer retention rate with a simple formula:
[(E-N)/S] x 100
where:
S is your existing customers at the start of the given period,
E is the total customers at the end of that period, and
N is the number of new customers added.
So, if you’re calculating retention across a year, start by identifying your total number of customers at the end of that year (E). Let’s say it’s 200.
Then, minus the number of new customers from that year (N), who say add up to 50.
But you had 300 customers at the beginning of the year (S).
In this case, your customer retention rate would be (200-50)/300 = 0.5. Multiplied by 100 gives you a 50% retention rate. That wouldn’t be excellent. We have found that the average customer retention rate for B2B brands is 77%.
What this metric doesn’t do is inform you of why customers are loyal. To find that out, you will have to link up your CRR with deeper customer experience metrics.
We’ll explore those below.
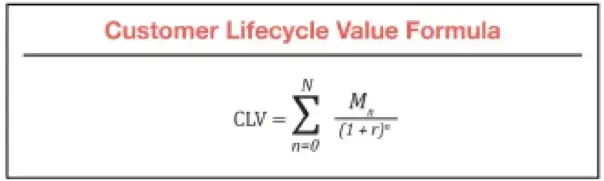
2. Customer Lifetime Value
Alternatively, customer lifetime value (CLV) shows you how much profit a particular customer has generated for you throughout their relationship. It gives you a direct insight into customer loyalty for a simple reason: the higher the value, the more loyal a customer has been.
A good CLV should be at least three times the cost of acquiring the customer. Meanwhile, a CLV that simply breaks even is negligible, and a CLV that is less is, of course, a loss.
Once again, this measurement only shows you how much a customer has invested in your business on average. It tells you nothing about their level of satisfaction or their customer experience, drivers behind their loyalty.
Customer lifetime value is a little more complex to calculate, but you can find out how to do it for yourself here: Customer Lifetime Value: What It Is & How to Measure It
3. Net Promoter Score
The metrics above are useful for benchmarking your retention and loyalty efforts. However, to understand the reasons behind your loyalty figures, you need something more sophisticated.
Typically, you will want to use Net Promoter Score (NPS), the customer experience metric that’s monitored by the majority of Fortune 1000. NPS measures the likelihood of customers recommending your product or service to others — a key indicator of future revenue growth.
It works by asking a simple question:
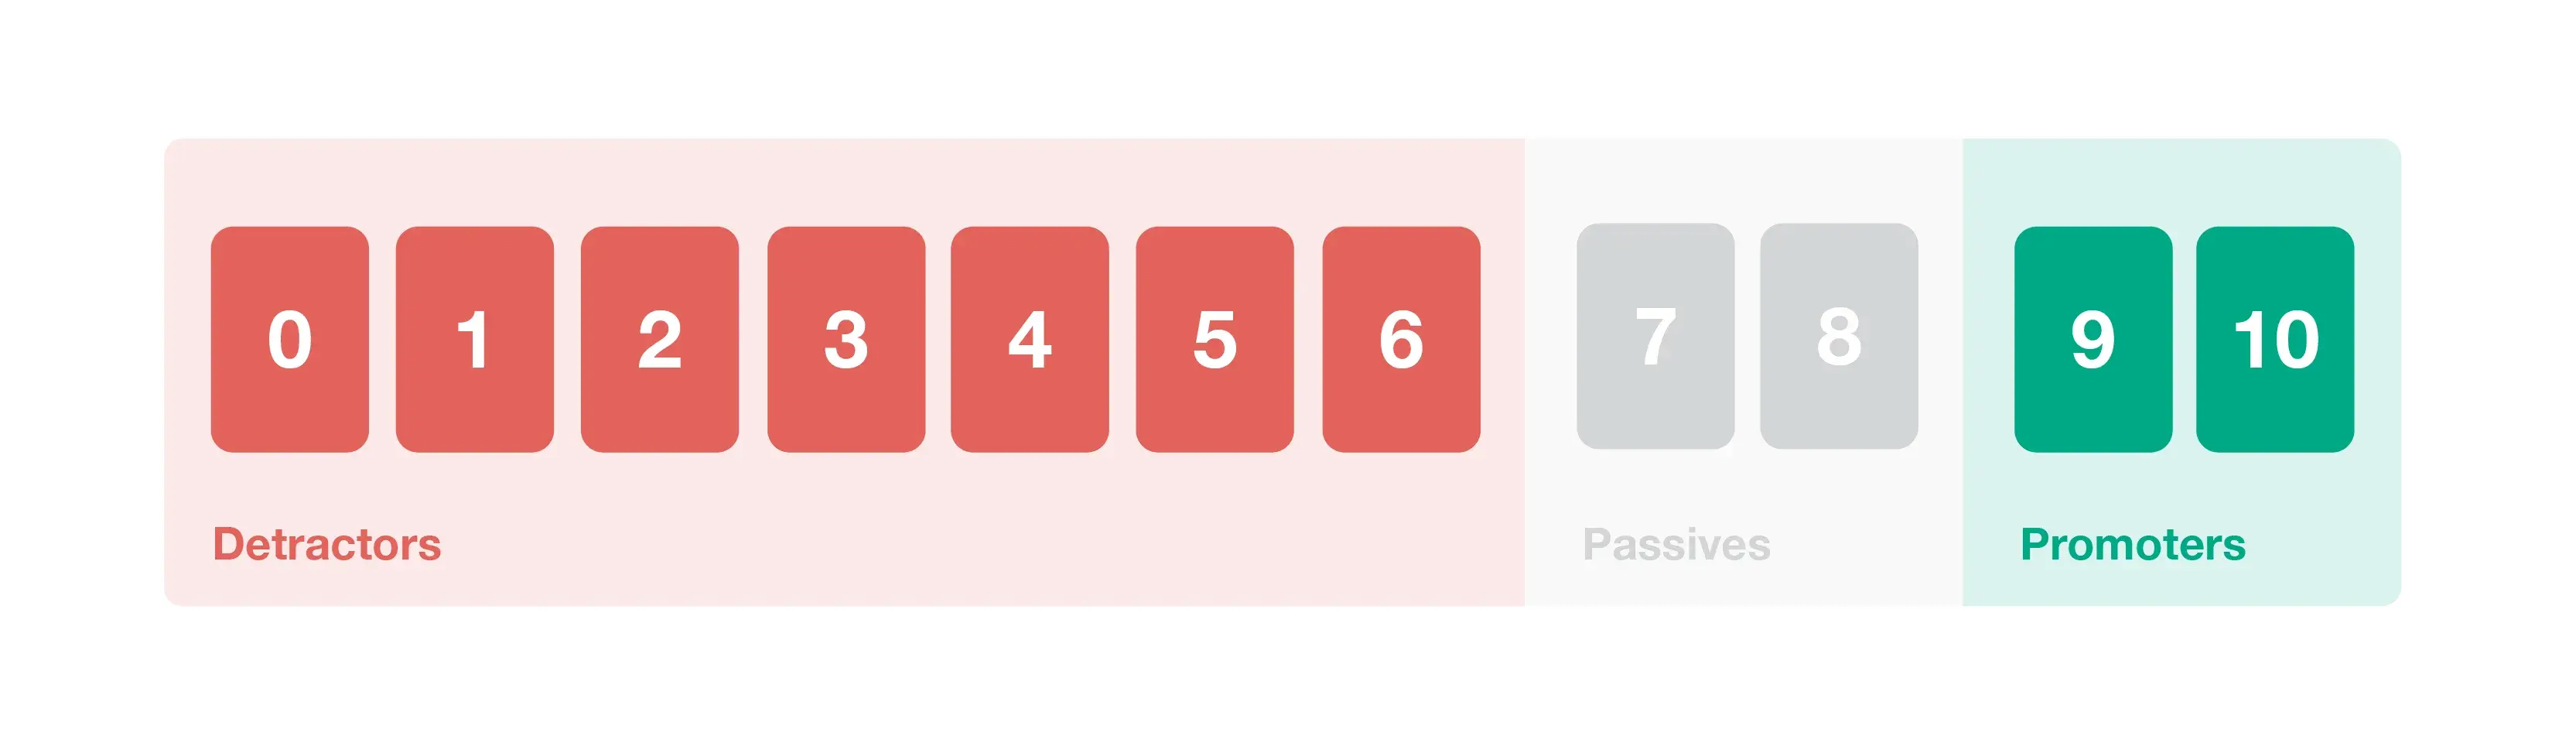
On a scale of 0-10, how likely are you to recommend our product/service/brand to a friend or colleague?
The responses to the question are then used to categorize your promoters, detractors, and passives. Promoters (who rate you 9 or 10) are your most loyal and enthusiastic customers, while detractors (who rate you 0-6) are at high risk of churn.
By subtracting your percentage of detractors from your percentage of promoters, you’ll get a score from -100 to 100. This is your overall NPS score and it’s an incredibly accurate barometer of your customer loyalty.
But what heritage NPS doesn’t do is give you insight into how customer loyalty directly affects your revenue.
That’s why at CustomerGauge, we’ve taken this metric a little further. We designed monetized NPS, one of the central metrics in our Account Experience methodology.
Monetized NPS gives you a clear picture of how your customer experience data directly impacts revenue.
Find out more here: What Does It Mean to Monetize NPS?
4. Customer Satisfaction
These days, customer satisfaction (CSAT) surveys are used a little less often than NPS.
41% of B2B brands use NPS, compared to 26% that use CSAT. While NPS comes with substantial benefits, CSAT can still be extremely useful for understanding your customer retention.
Typically, in a CSAT survey, you’ll ask customers how satisfied they are with a particular interaction. This isn’t the most reliable indicator of loyalty in the long term, but it does show you that you’re satisfying your customers’ needs — and that’s an important gauge in itself.
Simply ask “How satisfied are you with [x]?”, where [x] is a part of your customer journey.
Then receive responses on a 10-point scale. Use it alongside NPS for the best results!
5. Customer Effort Score
Another commonly used customer experience metric is customer effort score (CES). This works on the assumption that the more difficult interaction is with your brand, the less happy your customers will be (and the less likely they’ll be to make another purchase with you).
To measure this, customers are asked a question such as:
How easy was it for you to solve your problem today? Alternatively, ask them to agree or disagree with a statement like: It was easy for me to solve my problem today.
To be useful, CES needs to be combined with a follow-up question so that you can understand why customers feel the way they do.
Find out more about the three customer experience metrics here: NPS vs CES vs CSAT: Which Customer Experience Metric To Use?
6. Driver Questions
Now, it’s not a metric—we know.
But, it needs to be included here regardless. Whichever customer experience metric you use, NPS, CSAT, or CES, there’s one thing you must do to truly understand your customer loyalty: dig into the drivers behind your customer responses.
Luckily enough, that’s not a difficult task. Every NPS or CES question you ask needs to be followed up by a driver question. After your NPS question, ask “What is the reason for the score you gave today?”
This allows customers to tell you what they like, and don’t like, about your brand. And just as this will show you why loyal customers stay, it will show you what’s having a negative impact on your loyalty, too.
7. Engagement
There’s one important way to measure and predict customer loyalty that often goes overlooked. That’s engagement.
Typically, we can say that the higher a customer’s engagement is with your brand, the more likely they are to continue to be your customers into the future. On the flip side, an absence of signal, meaning no engagement whatsoever, is a powerful predictor of churn.
You can track engagement rates simply by monitoring the following:
Survey responses. If your customers aren’t responding to surveys at all, it might be a sign that they’re not happy with the service they’re receiving. Not all detractors tell you they are detractors!
Support requests. The number of support tickets customers file flags some important things. If there are too few, customers may not be using the product as much as they could (which is a signal of churn risk). Too many, though, and your customer may be having persistent problems, which may reduce their chance of sticking around.
Usage and activity. If you’re a SaaS brand, you can track activity on different customer accounts by monitoring logins. If your product is not being used, it’s unlikely that customers will stay loyal.
At CustomerGauge, our Account Experience platform enables you to track customer behavior through 360 Customer Tracking. This ensures that you know how often an account is engaging with your product to intervene and prevent customer churn.
8. Repeat Purchases and Referrals
Finally, it’s worth remembering the three very simple indicators that can help you identify your most loyal customers:
Repeat purchase. The definition of a loyal customer is that they make repeat purchases. To monitor the loyalty of a particular customer, tracking purchases from individual accounts is a must.
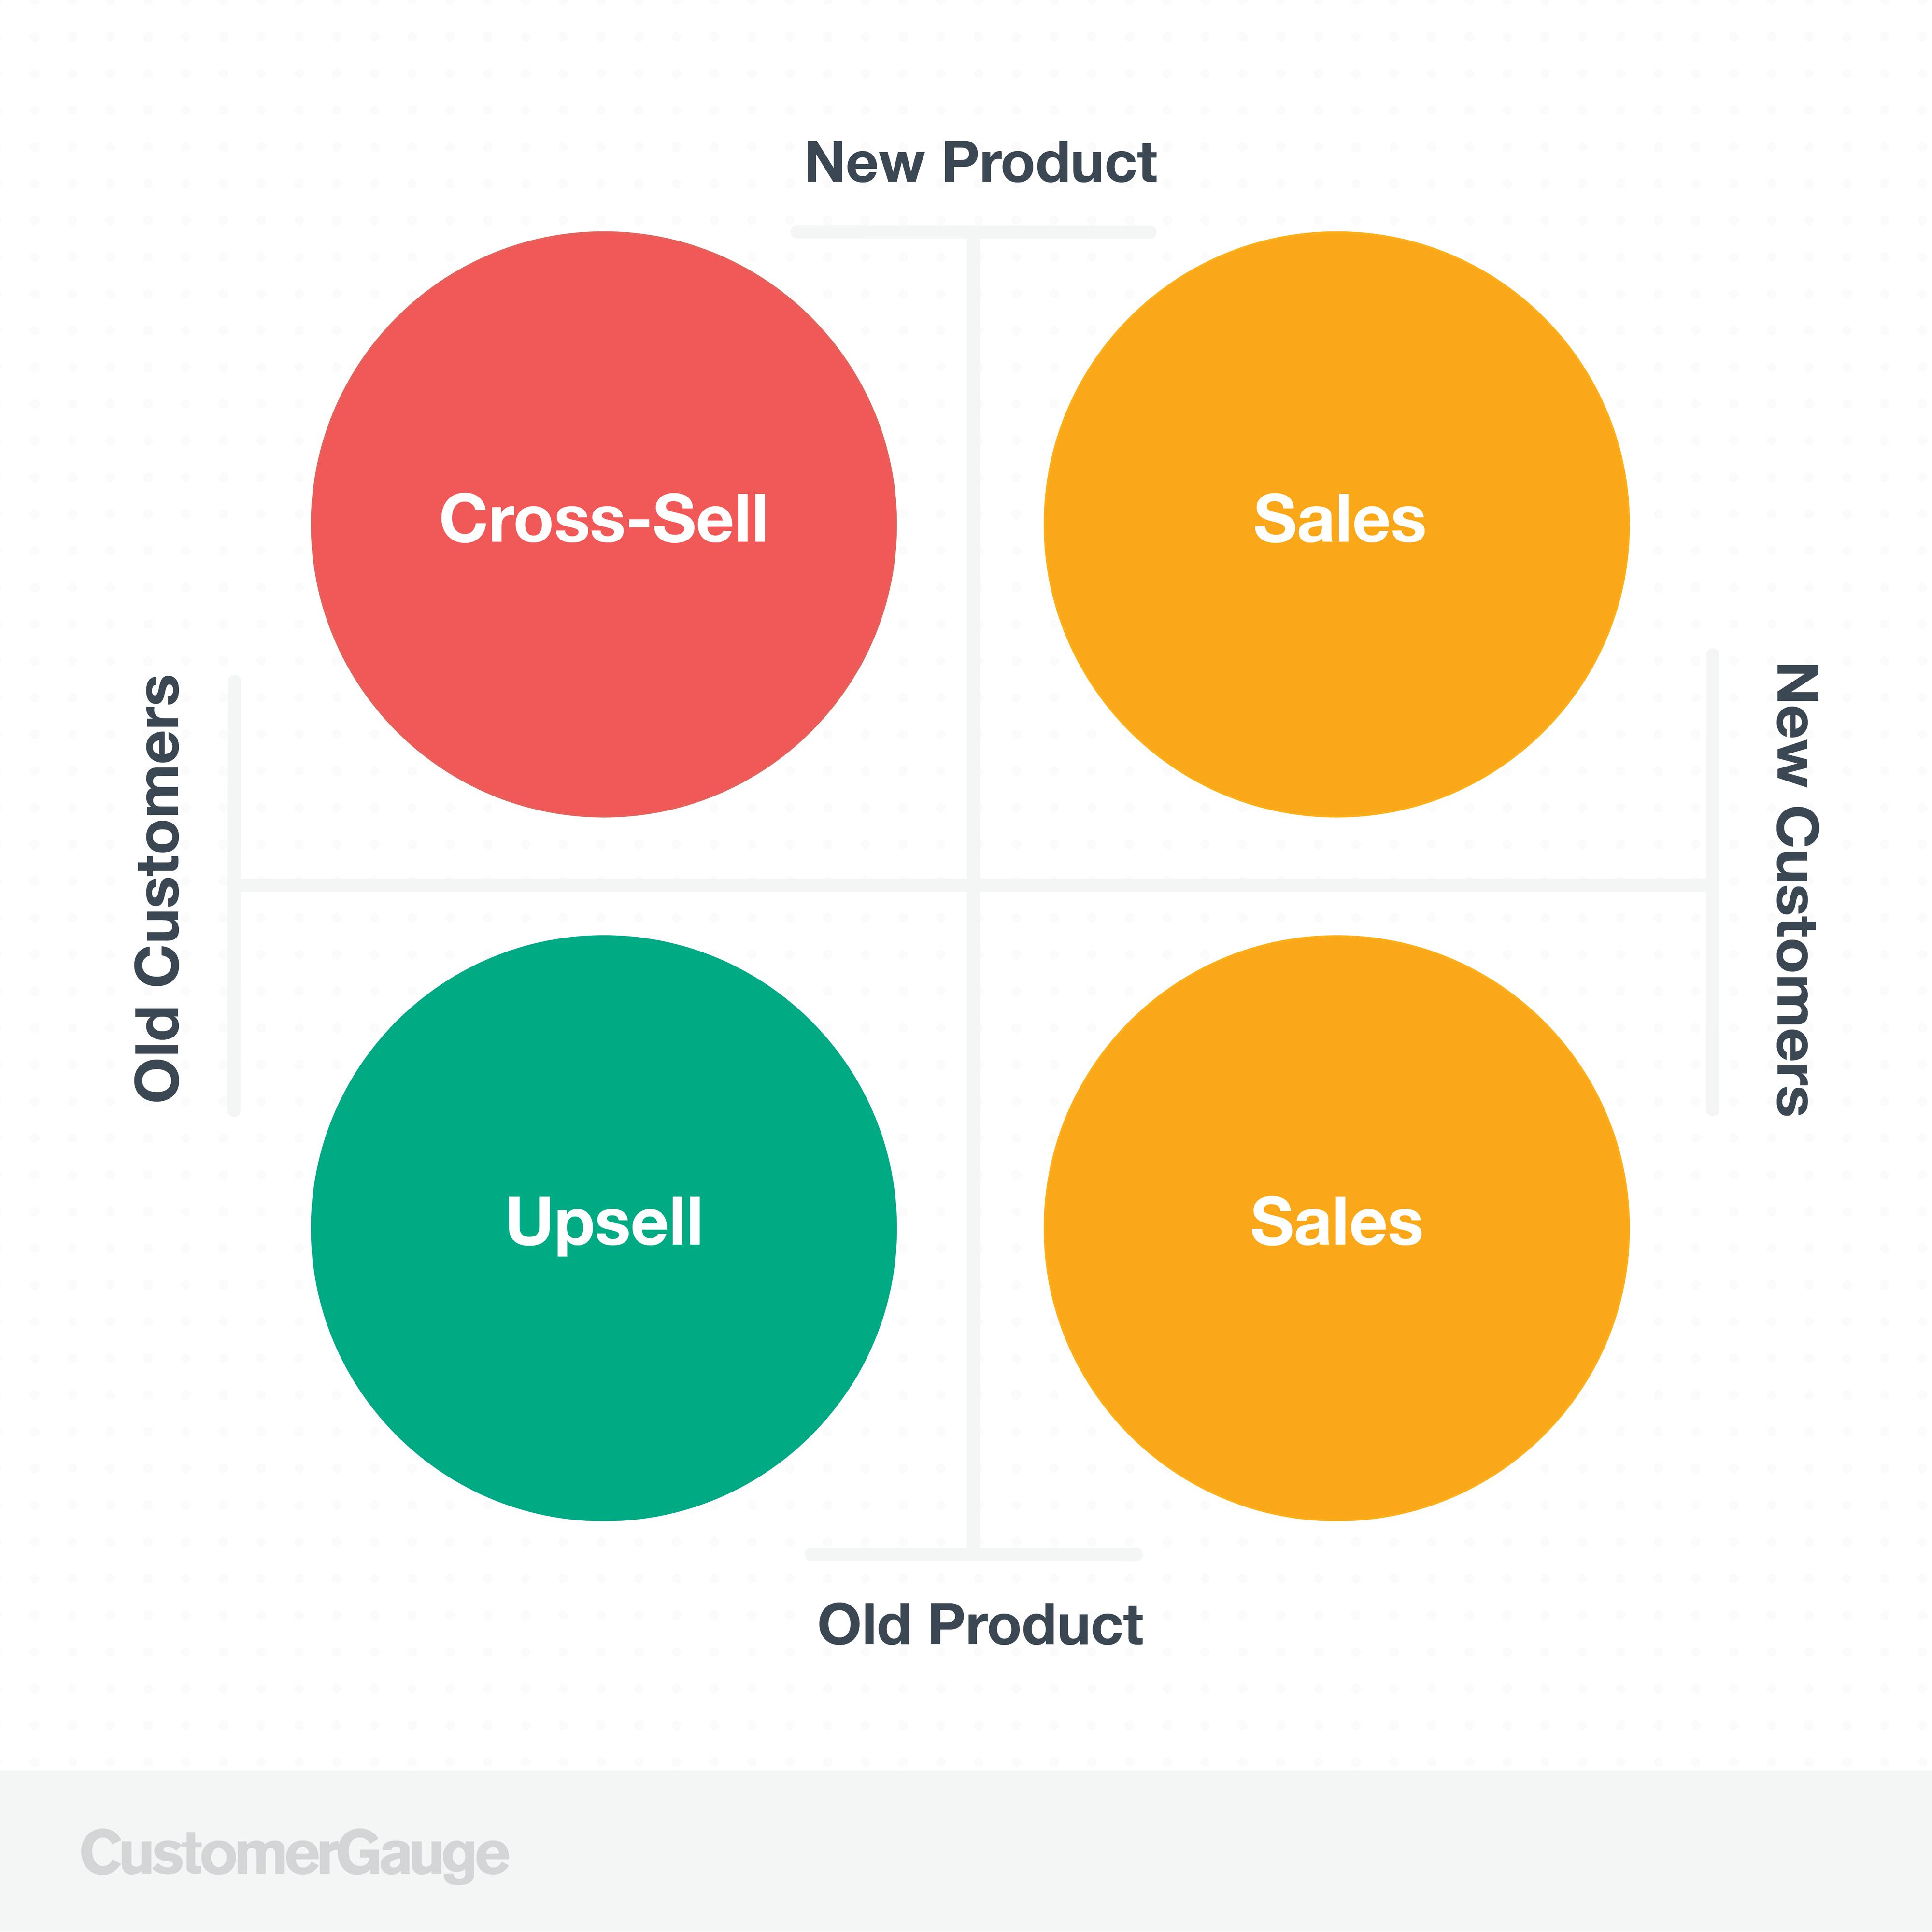
Upsells. Satisfied customers are known to spend 140% more. However, according to our own research, 47% of B2B brands aren’t measuring upsells or cross-sales. This means that they don’t know which customers are having the biggest impact on their business.
Referrals. In the NPS system, promoters are your most loyal customers, identified by how likely they are to recommend your brand. As a business, you should be transforming likely referrals into real referrals, by setting and measuring your referral campaign.
Metric | What It Measures | Predicts Churn? | Revenue-Linked? | CG Platform |
Customer Retention Rate (CRR) | % of customers retained over a period | Partially — backward-looking | Indirect | Tracked in AX dashboard |
Customer Lifetime Value (CLV) | Total revenue from a customer relationship | No — historical only | Yes — directly | CLV by account in AX |
Net Promoter Score (NPS) | Loyalty + likelihood to recommend | Yes — detectors identify at-risk accounts | Yes — via monetized NPS | Core AX metric |
Customer Satisfaction (CSAT) | Satisfaction at a specific touchpoint | Partially | Weak | Supported in AX surveys |
Customer Effort Score (CES) | Ease of completing a specific interaction | Partially — high effort = churn risk | Weak | Supported in AX surveys |
Driver Questions | Why customers gave their score | Yes — identifies root cause issues | Yes — links drivers to churn revenue | Driver analysis in AX |
Engagement Tracking | Frequency and depth of customer interaction | Yes — absence of signal = churn flag | Indirect | 360 Customer Tracking in AX |
Repeat Purchases + Referrals | Active loyalty behaviors | No — confirms loyalty, not predicts | Yes — directly | Revenue + referral tracking in AX |
Get Real-Time Insight Into Customer Loyalty
CustomerGauge’s customer experience platform can show you all of these metrics and more. We’ll help you track customer engagement, monitor their purchases, and enable you to gauge their sentiment through CX surveys.
We’ve been ranked the #1 customer experience platform for B2B brands by Gartner.
Or explore how B2B teams across 11 industries are measuring loyalty and reducing churn in the State of B2B Account Experience report.
Hey there! Did you know we have a library of customer loyalty articles? Check these topics out:
About the Author