Customer churn is one of the biggest problems companies face.
Yet the size of the issue isn’t always fully appreciated. In reality, across the economy, the cost of churn is estimated at nearly $2 trillion every year. That’s as much as one of the world’s 10 largest economies.
Even at the level of individual companies, churn isn’t taken as seriously as it should be. For example, in our The State of B2B Account Experience report, we found that 70% of companies don’t have visibility on the financial impacts of their customer experience efforts.
Specifically, 44% of business leaders aren’t able to tell you their own company's churn rate. This speaks of a massive oversight when it comes to precise data on customer retention and loyalty.
But just because everyone else is missing out, it doesn’t mean that you should too. In this complete guide to customer churn, we show you all you need to know—from measuring your churn rate to putting in steps to boost your customer retention.
We’ll also introduce you to Account Experience, our customer retention methodology that helps frontline commercial teams to tackle churn and drive account expansion systematically using voice of customer feedback.
Our Account Experience software, which pairs with the methodology, has been ranked by Gartner as the number one voice of customer platform for B2B brands.

What Is Customer Churn? The Meaning & Definition of Churn
Customer churn refers to the number of customers that have stopped using and paying for your product or service.
It’s usually measured within a particular timeframe—typically a monthly, quarterly, or annual churn rate. But, whichever you use, you should be aiming for a churn rate that’s as close as possible to zero.
Why? Because churning customers equals lost revenue—and more work for you to do to deliver growth.
But churn happens for many different reasons. Maybe your customer experience isn’t up to scratch, your customers don’t trust your brand, or your product just doesn’t do what customers want it to. Ultimately, to tackle your churn problem, you need to understand exactly why it’s happening in the first place.
Why Is Customer Churn So Important?
Customer churn isn’t just an abstract problem. It has real concrete impacts for your business—and your bottom line.
Churn means loss of revenue. For every customer that churns, you’re losing potential profits. To have a clear idea of your churn rate, you’ll need to measure both the number of customers that churn and the amount of churning revenue too.
Companies with high churn spend more on finding new customers. Often, businesses put a sticking plaster over their churn problems by putting all their resources into customer acquisition. It’s a costly way to balance the books—because it’s thought to be as much as 25 times more expensive to sell to a new customer than to an existing one.
Churn often points to customer experience (CX) problems. Customers are leaving for a reason. It could be that they’ve gone off your product, their CX has been poor, or they’re paying too much. Whatever the reason, they’re likely unsatisfied—and you want to know why (so you can change in the future).
Customers are likely going to a competitor. Customers were using your product because they had a problem to solve. Very likely, they still have that problem—but they’re just paying someone else to help them solve it.
Churn customers may spread negative word of mouth. Ultimately, your customers may tell other prospects why they’ve left your brand—and that might hurt your efforts to acquire new customers.
Churn can point to problems across your business. But how can you measure churn? Let’s find out.
“Onboarding CustomerGauge has had the highest ROI of anything I've ever done at my company."
How to Calculate Customer Churn
To measure and analyze your churn, you’ll want to use two key metrics: customer churn rate and revenue churn. These give you a simple snapshot of the size of your churn problem.
As CustomerGauge’s VP for Education and Program, Cary Self, recently said in an interview,
“There’s a huge misconception around how much effort it takes to measure churn. It’s not difficult. Compare your current business to where it was last year, while not looking at new acquisition. This difference will tell you how much liability you have around your customer experience.”
Let’s see how it works in practice.
Customer Churn Rate (CCR)
Customer churn rate—or CCR—is the metric that gives you the clearest insight into the size of your churn problem. Simply, it tells you how many customers churned over a given period of time. And that’s a crucial benchmark for your customer retention progress.
To calculate your customer churn rate, use the following formula:
(churned customers / total customers at the start of period) x 100
For example, imagine that at the beginning of the year, you had 300 customers, but 50 of them left this year. Do the calculation 50/300 to get 0.166666. Your customer churn rate would therefore be 16.6%.
To make that as simple as possible, let’s break it down:
Decide your time period (a month, year, or quarter). This is important, because your monthly churn rate will be a lot different to your annual churn rate. To make CCR useful as a benchmark, you want to be consistent with which period you use.
Work out how many customers you had at the beginning of that period.
Find the number of customers that churned during that period.
Divide the number of churned customers by the number of customers at the beginning of the period.
Multiply that number by 100 to get your churn rate.
Ultimately, CCR won’t tell you anything apart from the absolute number of customers that have churned. So, if you want to understand the financial impacts of churn (and we suggest you do), you’ll need to consider revenue churn too.
Revenue Churn Rate
In B2C contexts, the proportion of revenue you lose to attrition is typically similar to the proportion of customers that churned. But in B2B contexts, different customer accounts can vary massively by size. That can make your CCR and your revenue churn quite different.
To find your revenue churn rate, you’ll need another similar simple formula:
(churned revenue / total revenue at start of period) x 100
To get an accurate picture, you’ll need to understand the amount of revenue you’ve lost in absolute terms.
Say your revenue at the start of the period was $3,000, made up of 10 customers: two worth $500, two worth $400, two worth $300, two worth $200, and two worth $100. During the period, you lost the two worth $500 and the two worth $400. That’s $1,800 churned.
In this case, your CCR would be 40%: (4 churned customers / 10 customers to start with) x 100. But your revenue churn would be 60%. 1800/3000 = 0.6. Multiplied by 100 = 60%.
That makes a huge difference—because you might be retaining a majority of your customers, but you’re losing a majority of your revenue to churn.
Let’s break down the steps to follow again:
Decide your time period.
Work out how much revenue you had at the beginning of that period.
Calculate the total value of churned customers.
Divide the churned revenue by the revenue at the beginning of the period.
Multiply that number by 100.
What’s the Average Customer Churn Rate?
Once you have found your own churn rate, you’ll no doubt be wondering—what is a good churn rate? That really depends on the industry that you’re working in.
According to our own data, B2B brands on average have an annual churn rate of 23%. In more detail, here’s how retention rates break down by industry. Minus the retention rate from 100 to get the churn rate:
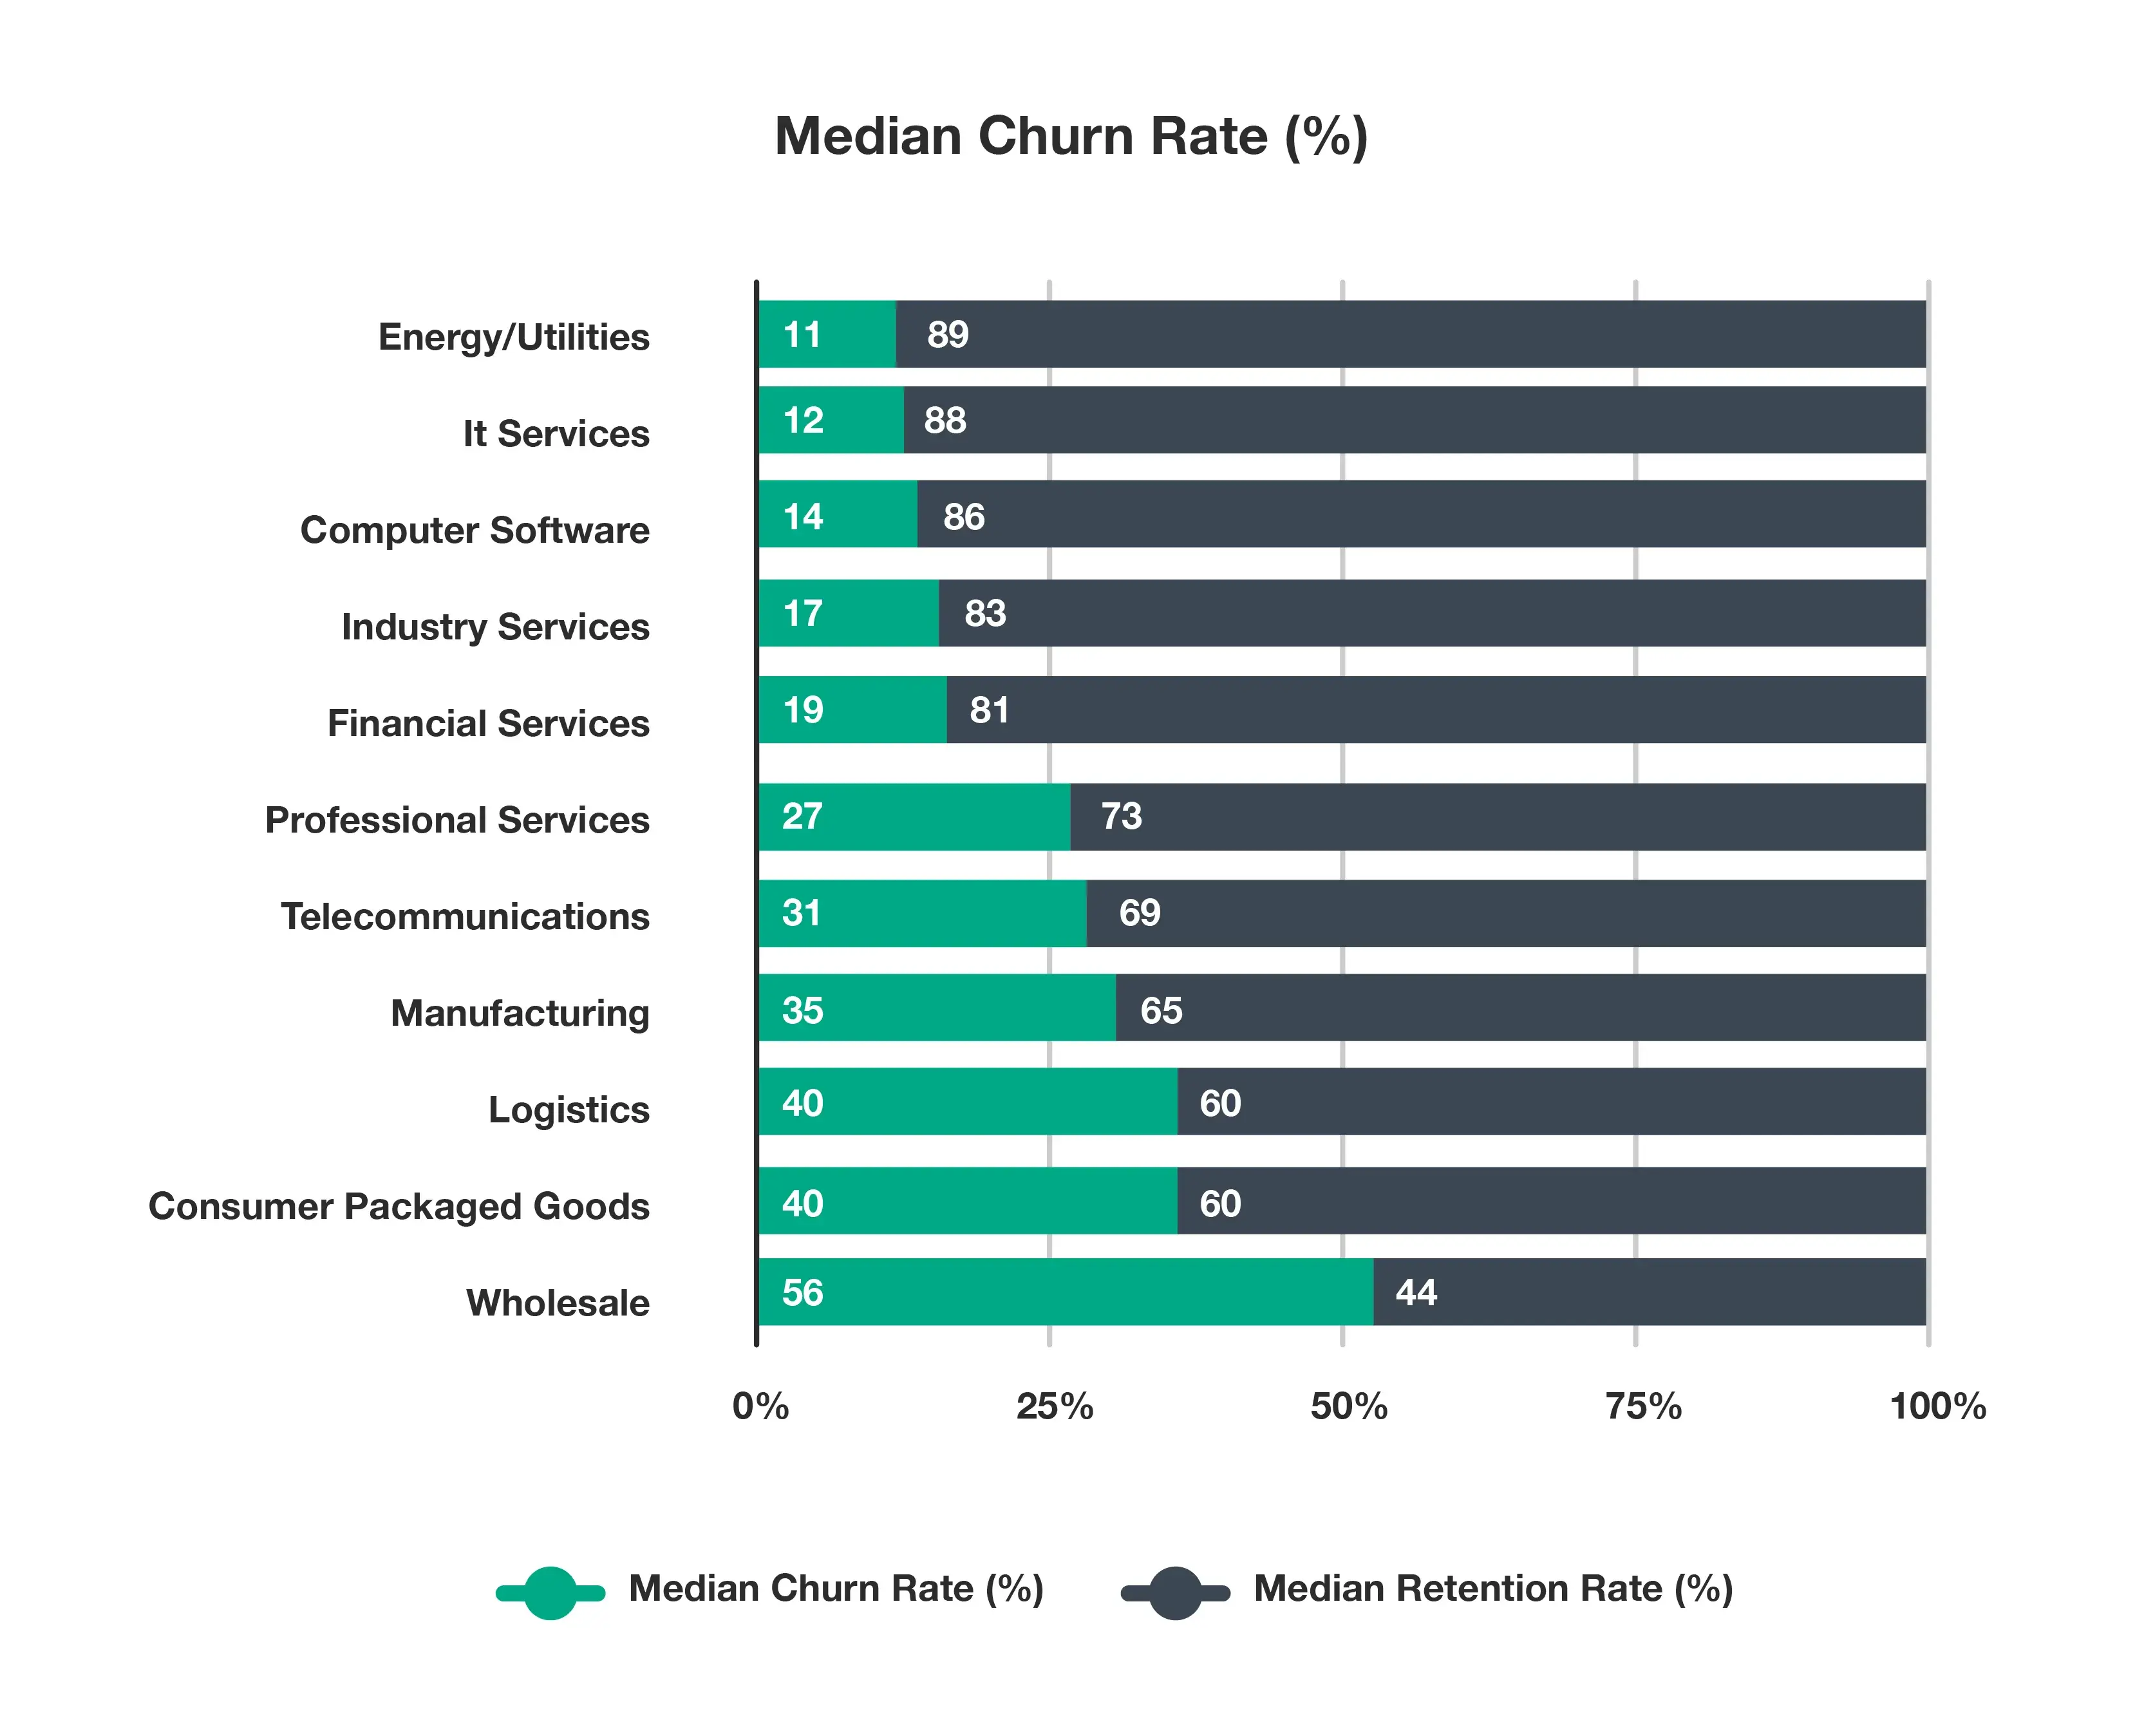
How do you compare to your competitors? What’s for sure is that, whatever your score, there’s probably room for improvement. Here’s how to get started to cut churn and improve retention.
How to Predict Customer Churn With Account Experience
At CustomerGauge, we teach our clients our proprietary churn-cutting methodology: Account Experience (AX). We designed this program to help B2B brands understand and improve their retention—and, crucially, drive their revenue.
Cutting churn happens in three main steps: identifying churn risk; analyzing who is churning and why; and implementing strategies to reduce churn. Here, we’ll take you through what you need to know to excel at each step.
By the way, preventing and reducing churn is much easier with CustomerGauge’s Account Experience retention software. Here, we’ll show you what it can do for you.
Detecting Customer Churn Risk
Customers don’t churn out of the blue—or at least they shouldn’t. In the vast majority of cases, you can see churn coming. But only if you’re looking.
That makes churn prediction one of the most important weapons you have in the battle against customer attrition. The good news is that it’s much easier than you might think.
You have two main ways to understand in advance when your customers might churn.
Net Promoter Score (NPS) Surveys

One of the most powerful ways to predict churn risk is with Net Promoter Score (NPS). You may have heard of it already. It’s one of the most widely used and effective ways to gauge your customer sentiment.
NPS surveys work by asking your customers a simple question to understand their loyalty:
On a scale from 0 to 10, how likely are you to recommend our product/service/brand to a friend or colleague?
Based on their responses, you will group your customers into three categories:
Promoters (scoring 9-10). These are your most loyal and enthusiastic customers. While you shouldn’t take any customers for granted, promoters are unlikely to churn. Instead, they’re great opportunities for referral campaigns and reselling.
Passives (7-8). They’re not as enthusiastic as your promoters, but passives are not your biggest churn risks either.
Detractors (0-6). Detractors are your customers that are most likely to churn. They’re typically unsatisfied and willing to tell you that. If you don’t intervene with them after their survey, they’ll leave.
Finally, companies usually calculate their NPS score—a number between -100 and 100 that’s useful for benchmarking. To do this, simply subtract your number of detractors from the number of promoters. You can find the NPS results of thousands of different companies in our collection of NPS benchmarks.
However, the NPS score itself is not your most useful tool for predicting churn. Instead, you want to identify your detractors and passives to focus your churn prediction. Who are they? How many are they? And why are they about to churn? We’ll come to find the answer to these questions a little later on.
Yet there’s a problem: not every customer that is about to churn will tell you that by answering your surveys. In fact, we found that most customer surveys only get a response rate of an average of 12.4%.
At CustomerGauge, we take the hassle out of running customer surveys—and help you take steps to boost your survey response rate. And, most importantly of all, we’ll help you identify another churn prediction method to use alongside NPS surveys. That’s measuring engagement.
Engagement Metrics
We said that not all customers respond to your surveys. Yet if your response rate is low, you’ll really want to find out why.
As CustomerGauge’s Cary Self has said, “churn doesn’t come from feedback and data—it comes from a lack of feedback and data.” That means the lower your response rate, the higher the risk of churn.
In fact, at CustomerGauge, we talk about the absence of signal as one of the biggest indicators of churn risk. This is when customers don’t respond to surveys, don’t issue support tickets, and may not even turn up to business reviews.
Too often, non-responding customers fly under the radar—and can churn without you noticing. Don’t let that happen. Instead, monitor the following signs of life:
Survey responses. Survey engagement is a strong indicator of retention. But if no one in a customer account is responding to your customer surveys, it’s important to ask why. It could be that they’re unsatisfied but can’t be bothered to say why.
CRM activities. How often do customers engage with you through meetings, calls, or other channels? You should be tracking these engagements—to understand customer behavior and make sure your customer success team is doing enough.
Support tickets. The number of times a customer issues a request for support is a useful indicator of account health. Too many support tickets and it can show frustration within an account. Too few, and it may show they’re just not that interested.
Logins. SaaS brands can simply track activity on their products by monitoring logins. This will give you a good sense of how often a customer is using your product—a good sign of account health.
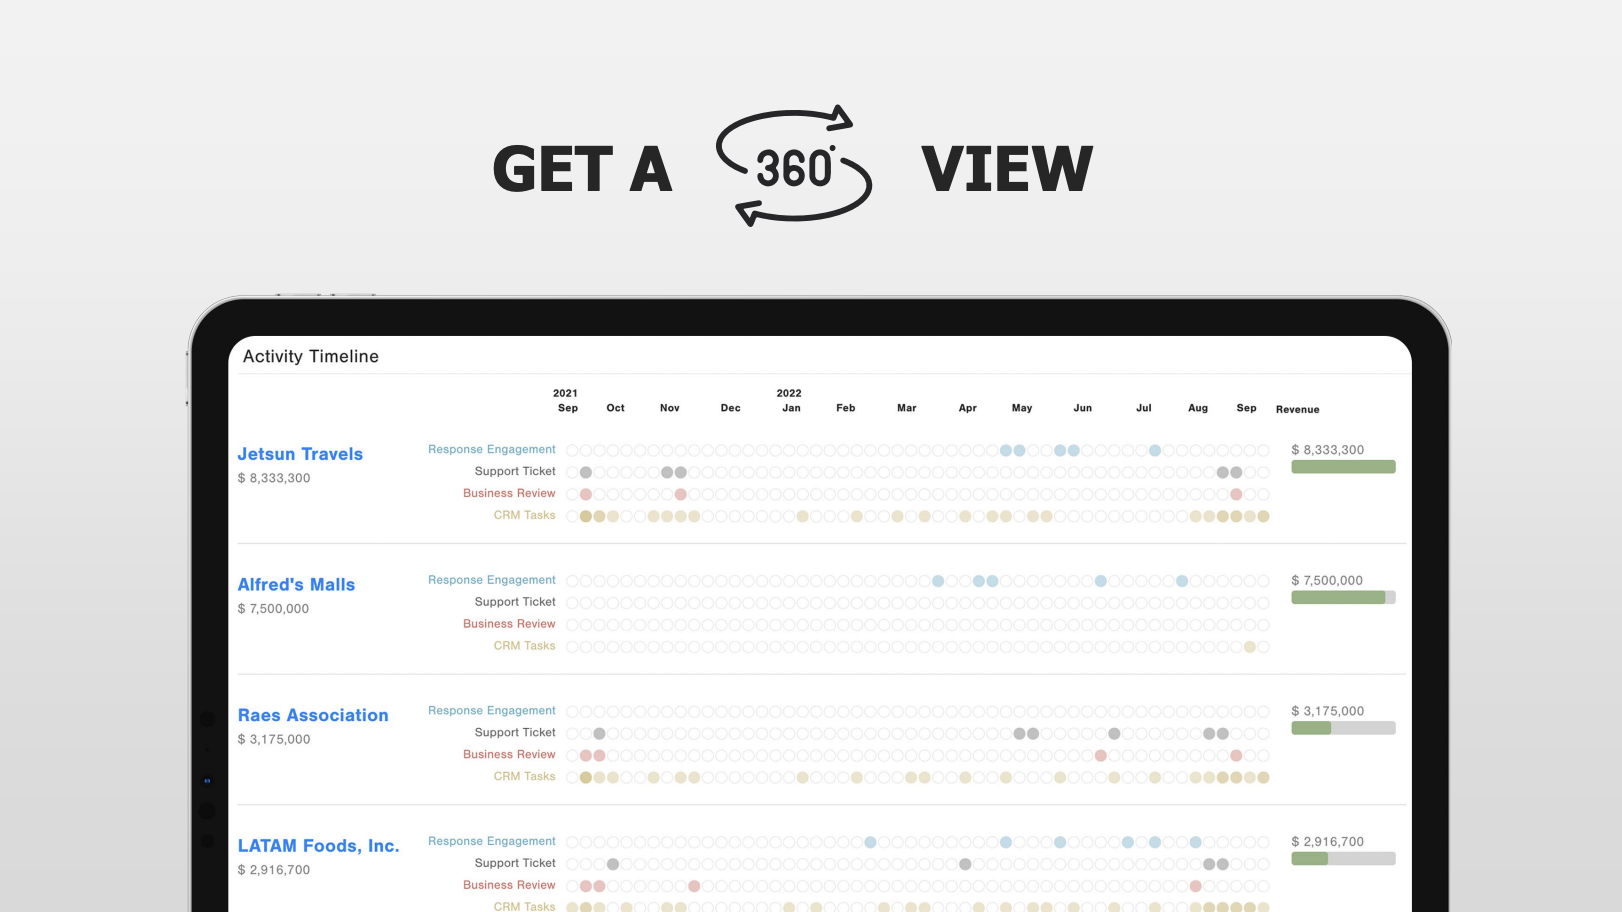
Monitoring all of these customer metrics will give you a much fuller sense of the health of your customer account—and the risk of customer churn. At CustomerGauge, our 360 Customer Tracking tool makes this easy.
Analyzing Customer Churn
Monitoring the predictors of customer churn is one thing. But understanding these metrics is quite another.
To conduct an effective customer churn analysis, you’ll need to dig into two key questions: who is churning (and how much are they worth?) and why? This second question will determine how you act to reduce churn.
Here’s Cary Self again:
“A big misconception is that there’s nothing a team can do to prevent churn. Not true! Once you know how to discover churn, you can identify the reasons behind it. We tell our customers all the time, start somewhere. One small action is better than no action and it will begin to retain customers, allowing you to focus on the next action.”
Identify the Value of Customers at Risk of Churn
Customer churn prediction will tell you which customers are likely to churn. Yet, not every customer that churns has the same value. If your churning customers are your highest-value customers, you have a much more urgent problem on your hands.
Your churn strategy should always have one eye on revenue. You can make the link manually, by tracking the customer lifetime value of your customers that churn. However, in large, complex B2B brands, this can become overwhelming.
At CustomerGauge, we designed monetized NPS to make it easier for B2B businesses to understand the impact of their customer sentiment on their bottom line. Meanwhile, you can easily see the impact your churn rate is having on revenue with our ROI calculator.
Understanding Why Customers are Churning
The second part of your customer churn analysis should be understanding the drivers of customer churn. This means understanding why your customers are leaving—so that you can intervene to improve their experience and secure continued business.
There are a few ways to get this information:
- NPS follow-up driver questions. After you ask the NPS question in your customer surveys, follow up with a question about the reasons behind the score they gave. We call these driver questions and they could look a little bit like these:
For promoters: What did you love about our product/service?
For passives: How can we improve your experience?
For detractors: What was missing or disappointing in your experience with us?
Transactional NPS surveys. Alongside conventional relationship surveys—in which you gauge how satisfied your customers are with your brand in general—run transactional surveys too. These ask how your customers feel about specific interactions with your brand. A template to use could be this:
Cancellation surveys. If you cannot intervene before churn happens, at least try to understand why customers have churned. Cancellation surveys, for example, can give you the information you need to improve for the customers that you are retaining.
How to Reduce Customer Churn
Finally, once you’ve analyzed your churn, there’s nothing left to do but stop it. Here, we share 5 key strategies to reduce customer churn—but you can find many more tips in our article here.
1. Close the Loop with Customers
Surveying your customers is an important part of preventing churn. But acting on their feedback is even more so. Strangely enough, it’s not something many businesses do. In fact, one Gartner study suggested that 95% of companies ask for feedback, but only 10% act on it and 5% tell their customers what they’ve done.
But we’ve found that closing the loop can increase your retention by as much as 8.5%. Why? Because it shows your customers you care—and that you’re committed to improve their experience.
Follow these best practices for closing the loop with customers.
Close the loop with everyone. In The State of B2B Account Experience, we found that only 26% of brands close the loop with all their customers. You should set a target of closing the loop with 100% of your customers.
Do it fast. We find that you get the best results if you close the loop within 48 hours. We found that it can help you secure a six-point boost to your NPS score.
Get everyone involved—from your frontline staff to your C-suite.
Set goals for closing the loop. Only 62% of B2B companies set goals for closing the loop. But our data shows that companies that set goals grow twice as fast as those that don’t.
Of course, there are different types of people in your customer business whose opinions you need.
There are those who use your products directly, for example, as well as the decision-makers who decide which products to buy. Typically, these different players will come from different levels in your client business.
To get the best engagement (and prevent churn) collect the contact details of as many individuals as you can. The results might be surprising. We found that surveying everyone can improve your retention by 18%.
While you’re at it, alongside improving coverage in individual accounts, do your best to improve your survey response rate across all accounts too.
3. Tackle Absence of Signal
Optimizing survey responses is an important part of any churn-reduction program. But remember that it may not give the fullest picture of your customers’ perspective.
That’s why we say you should work hard to optimize engagement signals at the same time. And tracking these signals should be the first step before actually tackling weak signals, or indeed no signal at all.
This means reaching out to customers on an individual level and having conversations about how they’re using your product and why. Think of it like closing the loop, but you won’t be responding to feedback.
4. Get All of Your People Onboard with Customer Retention
Customer churn reduction won’t be as effective if your business leaves it to one team (or just one individual) alone. Rather, improving your customer experience should be everyone’s responsibility—from your frontline staff right up to your C-suite.
Cary Self explains:
“Having worked with so many companies, one of the biggest mistakes we’ve all made is to make retention the responsibility of one person or one department. This is where most companies go wrong—because to better understand how to retain a customer you have to understand the customer journey, where each department engages with the customer and the impact each interaction has on overall loyalty.”
All departments need to be involved with the retention and growth strategy. Here, specific transactional surveys can help you identify which departments are holding back CX growth.
5. Invest in the Right Platform for Customer Churn Risk
In B2B contexts, customer journeys are typically highly complex and the different contacts in your customer account can be difficult to stay on top of. Investing in customer retention software designed specifically with B2B businesses in mind can take some of the complexity out of your churn-reduction activities—while giving you insights that you were otherwise missing.
“When we talk to B2B companies, we often hear them say that a CX solution will work,” Cary Self says. “The reality is, a B2B voice of the customer program like Account Experience is significantly more dynamic than a simple customer experience program.
“Think of it this way. Customer experience is very one-dimensional; it usually consists of one person speaking to one person getting feedback and putting out a fire. With Account Experience, companies are able to measure the relationship between multiple departments and multiple levels of an organization—and see the impact that relationship is having on revenue too.”
Book a demo with us to see for yourself how Account Experience works. In the meantime, let’s see how other B2B brands are using AX to cut churn themselves:
Three B2B Customer Churn Case Studies
Here are three examples of B2B customer churn we’re particularly proud of:
INAP is a data center manager that cut their churn rate in half in two years thanks to Account Experience. Part of the brand’s success came from C-level buy-in that helped launch the program, alongside visibility on the revenue impacts of their retention strategy. But there was one thing that had the biggest impact, as INAP’s TJ Waldorf said:
“Fueled by action are probably the most important words. It's one thing to just collect the data, but in my mind the crux of this program is to actually do something (with the data)."
Hear TJ speak about INAP’s program here: How INAP Reduced Churn by 50%
Alchemista. In 2019, the catering brand Alchemista lost its biggest client without warning. But by implementing Account Experience, it’s turned this around. Alchemista now boasts an astonishing 100% retention rate.
How did they do it? By setting up a customer feedback system that can continually deliver insights into customer sentiment. That’s letting them spot any CX hiccups before they turn into a serious problems.
Find out how we made it happen: How Alchemista Went From Losing Their Biggest Customer to 100% Retention
Until 2017, the IT brand, SmartBear, didn’t have a customer retention program to speak of. But in just 18 months of working with CustomerGauge, they managed to retain 60% of those customers at risk of churn.
And what’s more, they increased referral revenue by $6 million and boosted referral close rates by over 50% at the same time.
That was thanks to NPS surveys and engaging with multiple stakeholders in each account. Learn more: How SmartBear Brought in $6 Million in Referrals
Deep dive: 7 Strategies for Reducing Customer Churn in Telecoms
Cut Customer Churn with CustomerGauge
At CustomerGauge, we enable B2B brands to have deeper, more engaged relationships with their customers so you can cut churn.
